Time Table Generation via Graph Colouring Algorithm
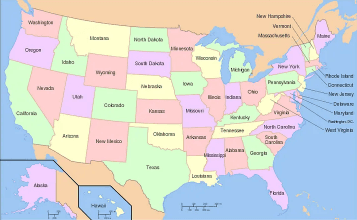
The assignment of labels to each vertex in an undirected graph is known as graph coloring. The color of a graph must be unique: two neighboring vertices, i.e. those with an edge connecting them, cannot share the same color. The issue originates from the dilemma of coloring a map, in which two neighboring countries (or states) must be colored differently.
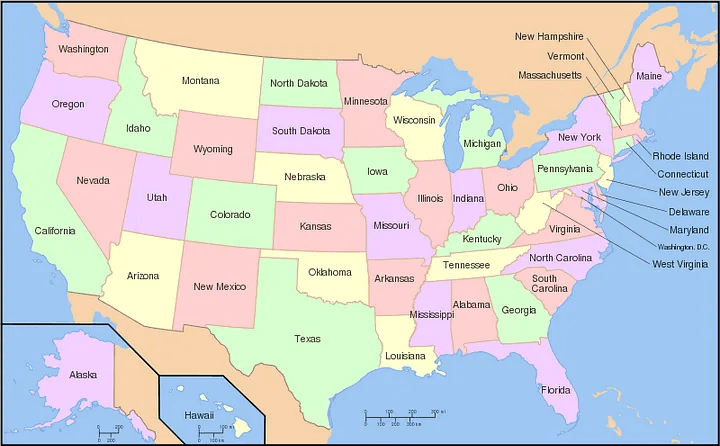
Here’s a map of the United States in only four colors:
Applications of Graph Colouring:
Data Mining
Image Segmentation
Clustering
Image Capturing
Networking
Making a Schedule or TimeTable
Register Allocation
Bipartite Graphs
Solving Sudoku Puzzles
Now that that’s out of the way, let’s get started on putting it into action:
We enrolled ’n’ students in ‘c’ courses, which includes ‘s’ semester, and each student had ‘x’ subjects.
Our goal with this data is to establish the most accurate timetable schedule for ‘t’ timeslots in order to accommodate classes from each subject of the semester of Course ‘c’ without clashing the time for different subjects of the same semester of the same Course.
We also addressed the possibility that any current semester student may have recourse from previous semesters. Previous courses and the semester’s time slots must also be controlled so that they do not overlap.
Step 1: Importing library.
import pandas as pd
import numpy as np
import itertools
import matplotlib.pyplot as plt
import networkx as nx
Step 2: Read the CSV file for which the graph is to be plotted.
https://github.com/aniforverizon/Time-Scheduling-using-Graph-Coloring
GitHub - aniforverizon/Time-Scheduling-using-Graph-Coloring
github.com
data = pd.read_csv('coursecsv.csv')
df = pd.DataFrame(data)
courses = df['Course'].unique()
n = len(courses)
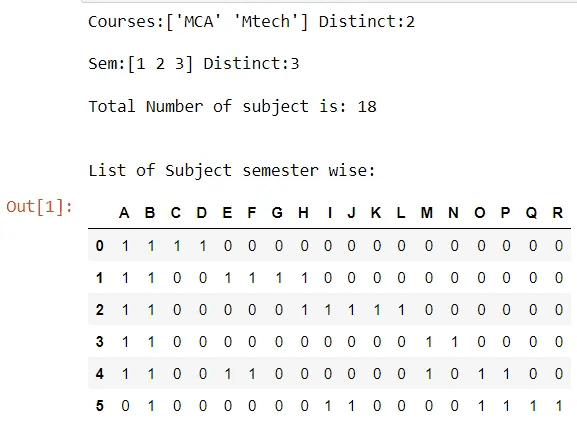
print(f"Courses:{courses} Distinct:{n}")
sem = df['Sem'].unique()
s = len(sem)
print(f"\nSem:{sem} Distinct:{s}")
Step 3: Creating an Adjacency Matrix for graph plotting. To begin, we establish a dictionary with all of the subjects as keys and values that range from 0 to the last subject.
c=[[[]*6]*s]*n
students=[]
subjects={}
i=0
courses_count=[]*n
for s1,s2,s3,s4,s5,s6,c in zip(df['Sub1'],df['Sub2'],df['Sub3'],df['Sub4'],df['Sub5'],df['Sub6'],df['Course']):
if s1 not in subjects and s1 == s1:
subjects.update({s1:i})
i=i+1
elif s2 not in subjects and s2 == s2:
subjects.update({s2:i})
i=i+1
elif s3 not in subjects and s3 == s3:
subjects.update({s3:i})
i=i+1
elif s4 not in subjects and s4 == s4:
subjects.update({s4:i})
i=i+1
elif s5 not in subjects and s5 == s5:
subjects.update({s5:i})
i=i+1
elif s6 not in subjects and s6 == s6:
subjects.update({s6:i})
i=i+1
print("\nTotal Number of subject is:",len(subjects))
Then we make an empty matrix and instruct it to insert data for each subject for each semester and both courses.
matrix = [[0 for i in range(len(subjects))] for j in range(s*n)]
for s1,s2,s3,s4,s5,s6,sem,course in zip(df['Sub1'],df['Sub2'],df['Sub3'],df['Sub4'],df['Sub5'],df['Sub6'],df['Sem'],df['Course']):
if course == 'MCA':
if s1 == s1:
matrix[sem-1][subjects[s1]]=1
if s2 == s2:
matrix[sem-1][subjects[s2]]=1
if s3 == s3:
matrix[sem-1][subjects[s3]]=1
if s4 == s4:
matrix[sem-1][subjects[s4]]=1
if s5 == s5:
matrix[sem-1][subjects[s5]]=1
if s6 == s6:
matrix[sem-1][subjects[s6]]=1
elif course == 'Mtech':
sem=sem+3
if s1 == s1:
matrix[sem-1][subjects[s1]]=1
if s2 == s2:
matrix[sem-1][subjects[s2]]=1
if s3 == s3:
matrix[sem-1][subjects[s3]]=1
if s4 == s4:
matrix[sem-1][subjects[s4]]=1
if s5 == s5:
matrix[sem-1][subjects[s5]]=1
if s6 == s6:
matrix[sem-1][subjects[s6]]=1
Student_mat=pd.DataFrame(matrix, columns=subjects.keys())
print("\n\nList of Subject semester wise:")
Student_mat
Step 4: Assign a color to each node.
reverse = dict(zip(subjects.values(),subjects.keys()))
color_subjects={}
CompleteGraph = nx.Graph()
k=1
x=1
for i in range(0,s):
sub=[]
G = nx.Graph()
for j in range(0,len(subjects)):
if matrix[i][j]==1:
sub.append(reverse[j])
chromatic=[0,1,2,3,4,5,6]
for y in range(0,i):
for z in range(0,len(subjects)):
if matrix[y][z] == 1 and reverse[z] in sub and color_subjects[reverse[z]] in chromatic:
chromatic.remove(color_subjects[reverse[z]])
index=0
for subject in range(0,len(sub)):
if sub[subject] not in color_subjects.keys():
color_subjects.update({sub[subject]:chromatic[index]})
index=index+1
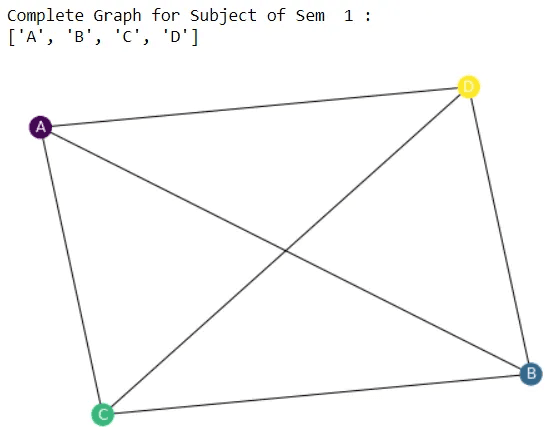
print("Complete Graph for Subject of Sem ",(x)%4,":")
print(sub)
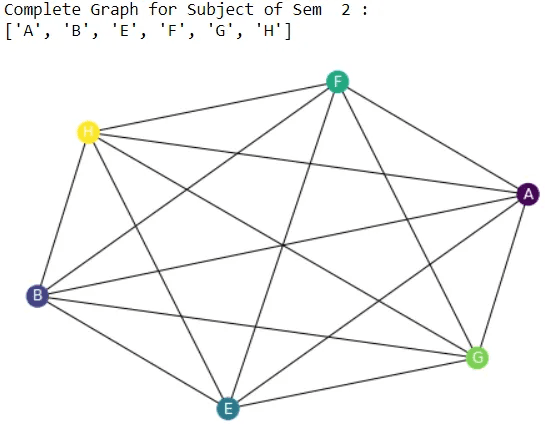
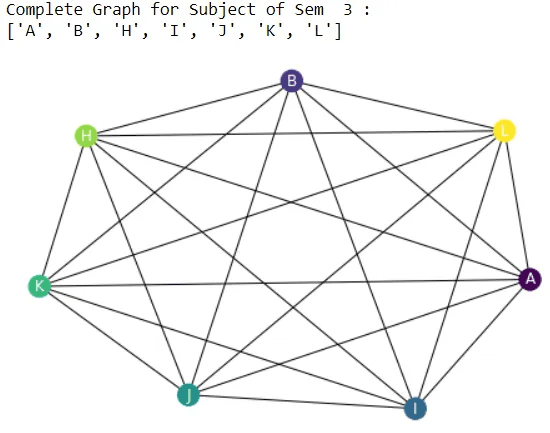
Step 5: Now we need to plot the graph.
x+=1
G.add_nodes_from(sub)
G.add_edges_from(itertools.combinations(sub, 2))
values = [color_subjects.get(node,0.25) for node in G.nodes()]
CompleteGraph.add_nodes_from(sub)
CompleteGraph.add_edges_from(itertools.combinations(sub, 2), weight =10)
nx.draw(G, cmap=plt.get_cmap('viridis'), node_color=values, with_labels=True, font_color='white')
plt.show()
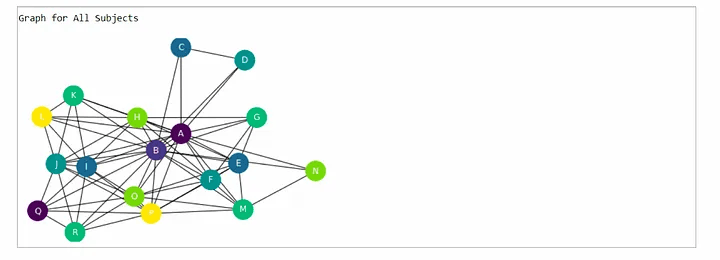
Step 6: We need to plot the graph for all the semesters.
print("Graph for All Subjects")
values = [color_subjects.get(node,0.25) for node in CompleteGraph.nodes()]
nx.draw(CompleteGraph, node_size=800, cmap=plt.get_cmap('viridis'), node_color=values, with_labels=True, font_color='white')
nx.draw
plt.show()
Step 7: This is the Final Schedule for each semester that is shown below.
data=np.chararray((6,9),unicode=True)
for i in range(0,n*s):
for j in range(0,len(subjects)):
if matrix[i][j] == 1:
data[i][2+color_subjects[reverse[j]]]=str(reverse[j])
final = pd.DataFrame(data, columns = ['Course','Sem', 'Slot1','Slot2','Slot3','Slot4','Slot5','Slot6','Slot7'])
for i in range(0,n*s):
if i < s:
final.at[i,'Course']=(df['Course'].unique()[0])
else:
final.at[i,'Course']=(df['Course'].unique()[1])
final.at[i,'Sem']=(df['Sem'].unique()[(i)%s])
print("\nFinal Schedule For Each Semester:")
final

As a result of this code, we were able to assign time slots to ’n’ students who were enrolled in ‘c’ courses, which included this semester, and each student had ‘x’ subjects. You can also get the code for reference from the same git that we used to get the CSV file.
I hope this blog was informative and provided you with the details you required. If you have any questions while reading the blog, message me on Instagram or LinkedIn.
Special credits to my team member — Umang Joshi and Krisha Amlani
Thank You…
The assignment of labels to each vertex in an undirected graph is known as graph coloring. The color of a graph must be unique: two neighboring vertices, i.e. those with an edge connecting them, cannot share the same color. The issue originates from the dilemma of coloring a map, in which two neighboring countries (or states) must be colored differently.
Here’s a map of the United States in only four colors:
Applications of Graph Colouring:
Data Mining
Image Segmentation
Clustering
Image Capturing
Networking
Making a Schedule or TimeTable
Register Allocation
Bipartite Graphs
Solving Sudoku Puzzles
Now that that’s out of the way, let’s get started on putting it into action:
We enrolled ’n’ students in ‘c’ courses, which includes ‘s’ semester, and each student had ‘x’ subjects.
Our goal with this data is to establish the most accurate timetable schedule for ‘t’ timeslots in order to accommodate classes from each subject of the semester of Course ‘c’ without clashing the time for different subjects of the same semester of the same Course.
We also addressed the possibility that any current semester student may have recourse from previous semesters. Previous courses and the semester’s time slots must also be controlled so that they do not overlap.
Step 1: Importing library.
import pandas as pd
import numpy as np
import itertools
import matplotlib.pyplot as plt
import networkx as nx
Step 2: Read the CSV file for which the graph is to be plotted.
https://github.com/aniforverizon/Time-Scheduling-using-Graph-Coloring
GitHub - aniforverizon/Time-Scheduling-using-Graph-Coloring
github.com
data = pd.read_csv('coursecsv.csv')
df = pd.DataFrame(data)
courses = df['Course'].unique()
n = len(courses)
print(f"Courses:{courses} Distinct:{n}")
sem = df['Sem'].unique()
s = len(sem)
print(f"\nSem:{sem} Distinct:{s}")
Step 3: Creating an Adjacency Matrix for graph plotting. To begin, we establish a dictionary with all of the subjects as keys and values that range from 0 to the last subject.
c=[[[]*6]*s]*n
students=[]
subjects={}
i=0
courses_count=[]*n
for s1,s2,s3,s4,s5,s6,c in zip(df['Sub1'],df['Sub2'],df['Sub3'],df['Sub4'],df['Sub5'],df['Sub6'],df['Course']):
if s1 not in subjects and s1 == s1:
subjects.update({s1:i})
i=i+1
elif s2 not in subjects and s2 == s2:
subjects.update({s2:i})
i=i+1
elif s3 not in subjects and s3 == s3:
subjects.update({s3:i})
i=i+1
elif s4 not in subjects and s4 == s4:
subjects.update({s4:i})
i=i+1
elif s5 not in subjects and s5 == s5:
subjects.update({s5:i})
i=i+1
elif s6 not in subjects and s6 == s6:
subjects.update({s6:i})
i=i+1
print("\nTotal Number of subject is:",len(subjects))
Then we make an empty matrix and instruct it to insert data for each subject for each semester and both courses.
matrix = [[0 for i in range(len(subjects))] for j in range(s*n)]
for s1,s2,s3,s4,s5,s6,sem,course in zip(df['Sub1'],df['Sub2'],df['Sub3'],df['Sub4'],df['Sub5'],df['Sub6'],df['Sem'],df['Course']):
if course == 'MCA':
if s1 == s1:
matrix[sem-1][subjects[s1]]=1
if s2 == s2:
matrix[sem-1][subjects[s2]]=1
if s3 == s3:
matrix[sem-1][subjects[s3]]=1
if s4 == s4:
matrix[sem-1][subjects[s4]]=1
if s5 == s5:
matrix[sem-1][subjects[s5]]=1
if s6 == s6:
matrix[sem-1][subjects[s6]]=1
elif course == 'Mtech':
sem=sem+3
if s1 == s1:
matrix[sem-1][subjects[s1]]=1
if s2 == s2:
matrix[sem-1][subjects[s2]]=1
if s3 == s3:
matrix[sem-1][subjects[s3]]=1
if s4 == s4:
matrix[sem-1][subjects[s4]]=1
if s5 == s5:
matrix[sem-1][subjects[s5]]=1
if s6 == s6:
matrix[sem-1][subjects[s6]]=1
Student_mat=pd.DataFrame(matrix, columns=subjects.keys())
print("\n\nList of Subject semester wise:")
Student_mat
Step 4: Assign a color to each node.
reverse = dict(zip(subjects.values(),subjects.keys()))
color_subjects={}
CompleteGraph = nx.Graph()
k=1
x=1
for i in range(0,s):
sub=[]
G = nx.Graph()
for j in range(0,len(subjects)):
if matrix[i][j]==1:
sub.append(reverse[j])
chromatic=[0,1,2,3,4,5,6]
for y in range(0,i):
for z in range(0,len(subjects)):
if matrix[y][z] == 1 and reverse[z] in sub and color_subjects[reverse[z]] in chromatic:
chromatic.remove(color_subjects[reverse[z]])
index=0
for subject in range(0,len(sub)):
if sub[subject] not in color_subjects.keys():
color_subjects.update({sub[subject]:chromatic[index]})
index=index+1
print("Complete Graph for Subject of Sem ",(x)%4,":")
print(sub)
Step 5: Now we need to plot the graph.
x+=1
G.add_nodes_from(sub)
G.add_edges_from(itertools.combinations(sub, 2))
values = [color_subjects.get(node,0.25) for node in G.nodes()]
CompleteGraph.add_nodes_from(sub)
CompleteGraph.add_edges_from(itertools.combinations(sub, 2), weight =10)
nx.draw(G, cmap=plt.get_cmap('viridis'), node_color=values, with_labels=True, font_color='white')
plt.show()
Step 6: We need to plot the graph for all the semesters.
print("Graph for All Subjects")
values = [color_subjects.get(node,0.25) for node in CompleteGraph.nodes()]
nx.draw(CompleteGraph, node_size=800, cmap=plt.get_cmap('viridis'), node_color=values, with_labels=True, font_color='white')
nx.draw
plt.show()
Step 7: This is the Final Schedule for each semester that is shown below.
data=np.chararray((6,9),unicode=True)
for i in range(0,n*s):
for j in range(0,len(subjects)):
if matrix[i][j] == 1:
data[i][2+color_subjects[reverse[j]]]=str(reverse[j])
final = pd.DataFrame(data, columns = ['Course','Sem', 'Slot1','Slot2','Slot3','Slot4','Slot5','Slot6','Slot7'])
for i in range(0,n*s):
if i < s:
final.at[i,'Course']=(df['Course'].unique()[0])
else:
final.at[i,'Course']=(df['Course'].unique()[1])
final.at[i,'Sem']=(df['Sem'].unique()[(i)%s])
print("\nFinal Schedule For Each Semester:")
final
As a result of this code, we were able to assign time slots to ’n’ students who were enrolled in ‘c’ courses, which included this semester, and each student had ‘x’ subjects. You can also get the code for reference from the same git that we used to get the CSV file.
I hope this blog was informative and provided you with the details you required. If you have any questions while reading the blog, message me on Instagram or LinkedIn.
Special credits to my team member — Umang Joshi and Krisha Amlani
Thank You…