
Implementing Load Testing and Real-Time Monitoring with JMeter, InfluxDB, and Grafana

Through this article, you will get to know about load testing using JMeter along with InfluxDB and Grafana. How the setup is done with the installation process mentioned below.
Load testing can be defined as the process of software testing in which the application is tested under specific expected load. For this purpose, we will first need to install JMeter. Real-time monitoring is the process of collecting and storing performance metrics for data as it traverses your network.
Contents:
Setting up JMeter on Windows
Creating a Test Plan
InfluxDB Installation and Setup
Grafana Installation
Run JMeter.
Setting up JMeter on Windows
Prerequisites: Java — Check it with the “java -version” command on your command prompt.
Downloading JMeter:
1. Visit this link and download the zip folder.
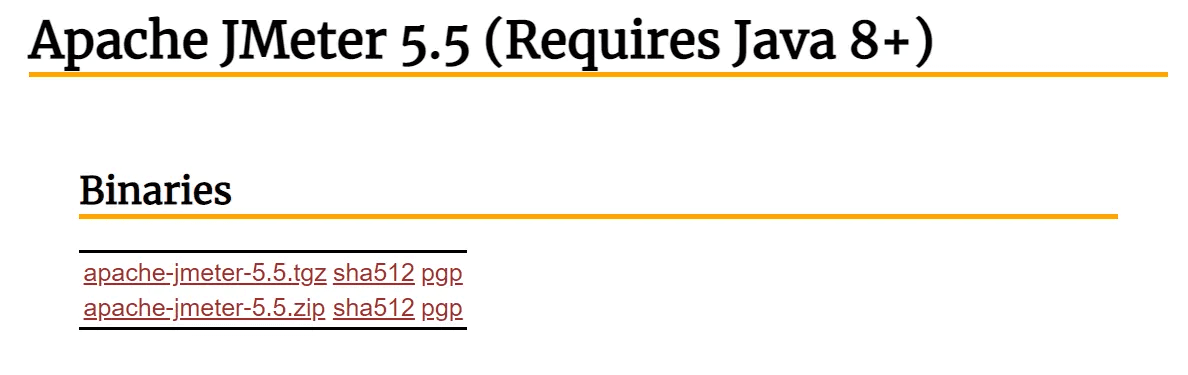
2. Extract the contents of the zip folder and navigate to “jmeter.bat” in the bin folder and open it. You can always open JMeter GUI this way by opening jmeter.bat file
Creating a Test Plan:
It is comparatively easy to create a test plan using available templates. We will use a Simple HTTP request template to load test the API.
Navigate to File >> Templates… in your JMeter GUI. Select “Simple HTTP Request” from the drop-down list. And click on Create button at the bottom
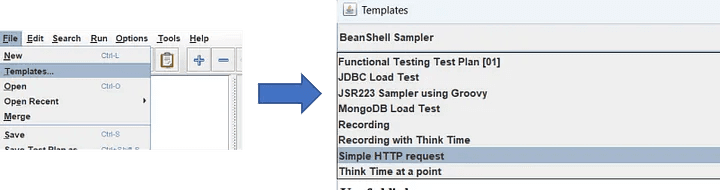
Drop-down Menu
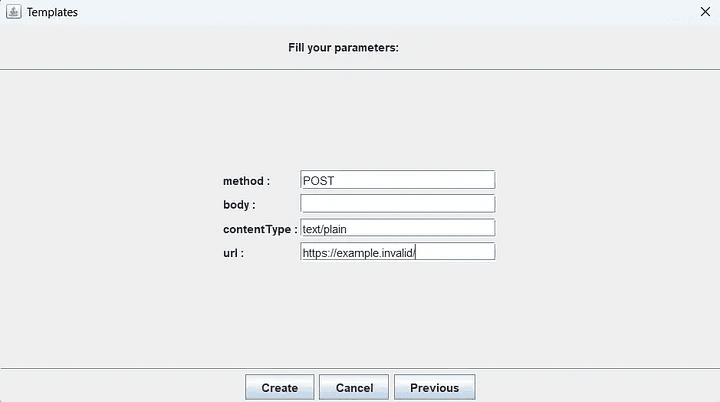
Fill in the necessary details and click on Create.
After successfully creating a template, we will be adding a Loop Controller, Sampler, and a few Listeners to our test plan and also setting up the thread properties.
Adding a Loop Controller: Add a loop controller by right-clicking on your thread group (as shown in the fig. below). Do the necessary changes.
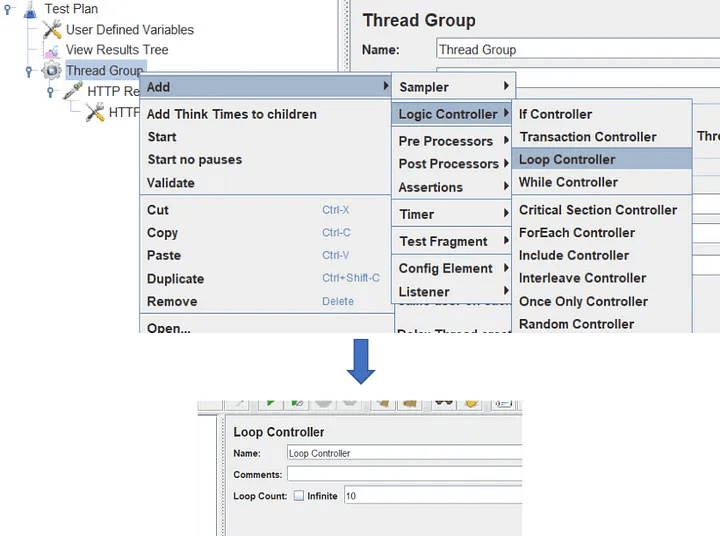
Loop Controller
Thread Properties: Click on “Thread Group” from the left panel and make the necessary changes.
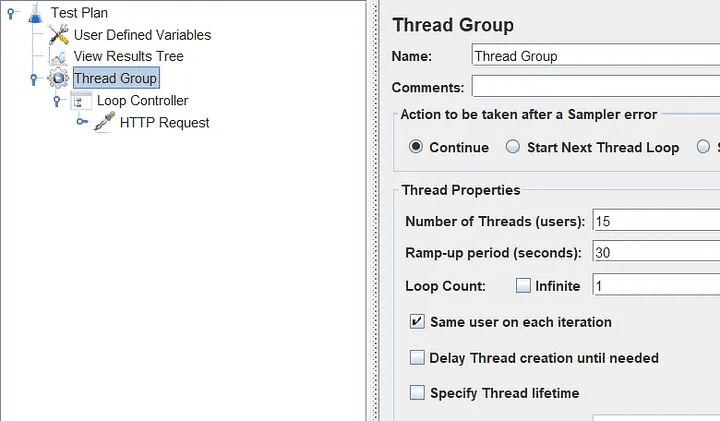
Thread Group
Adding a Sampler: Our template comes with an “HTTP Request” sampler. You just need to drag it under the loop controller (as shown in the above fig.) If you want, you can add a sampler just like we added the loop controller. Click on the “HTTP Request” sampler from the left panel.
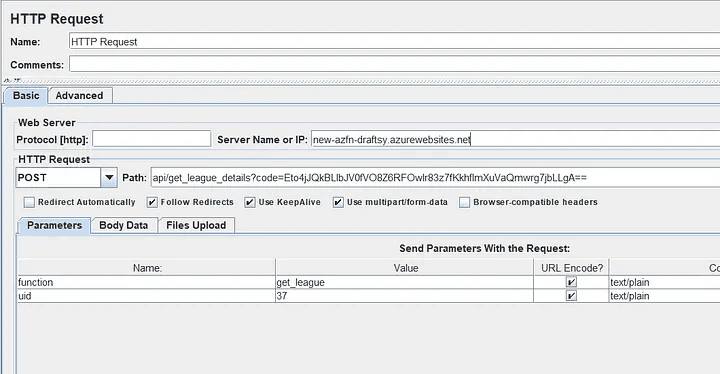
HTTP Request Sampler
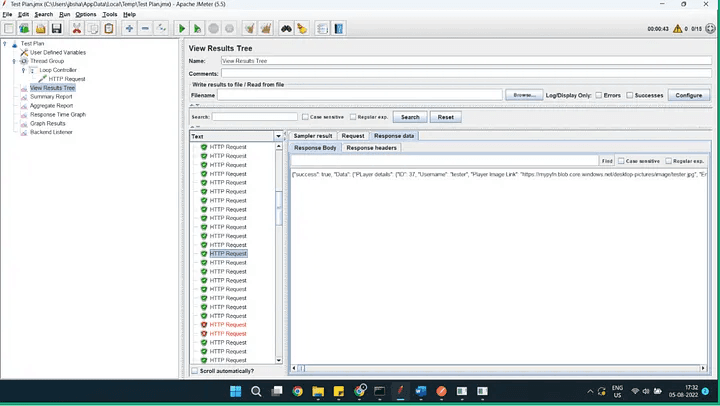
Adding listeners: Add the required listeners like backend listener, Results tree, and Aggregate Graph
Configure the Backend Listener: The backend listener is required to pass the summary data to InfluxDb database.
Select “InfluxdbBackendListenerClient” from the dropdown list.
Change the value of the Influxdb URL to: http://localhost:8086/write?db=jmeterdb(Note: jmeterdb is the name of the database in my InfluxDB. You can give any random name here, but make sure to create the InfluxDb database with the same name later.)
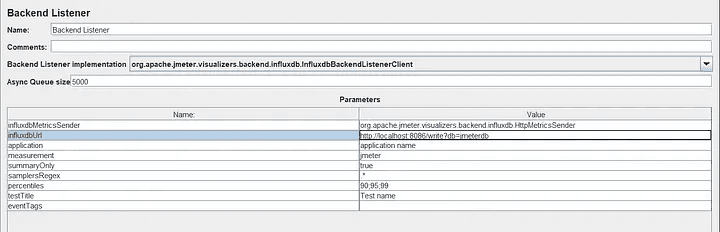
Passes the summary data to InFluxDB Database
With this, we have made all the necessary changes from the JMeter side required for Influxdb integration.
InfluxDB Installation and Setup
InfluxDB is a time-series database designed to handle high write and query loads. It is an integral component of the TICK stack. It is meant to be used as a backing store for any use case involving large amounts of timestamped data.
I’ve used Influxdb Version 1.8.10. You can download it from this link, Download the OSS Binary files for Windows.
Unzip the contents and navigate to the “influd.exe” file. Run the file to start the server.
Run “influx.exe” from the same folder to open CLI.
Run the following commands in influxdb CLI to create and use a database that will listen to the responses provided by JMeter.
Create database jmeterdb (Note: I have named my database as jmeterdb. You can give any random name but remember to give the same name in the JMeter Backend Listener URL.)
Use jmeterdb
With this, your InfluxDB is ready to listen to the JMeter responses.
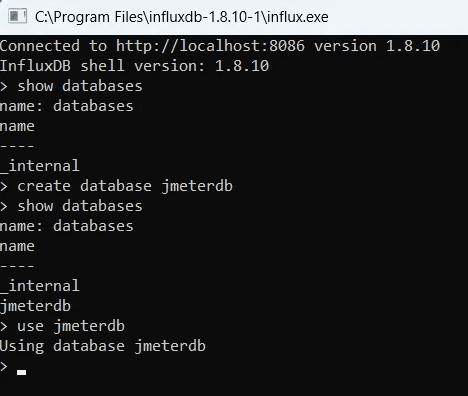
Connected to the Server
Grafana Installation
https://grafana.com/grafana/download?platform=windows&edition=oss
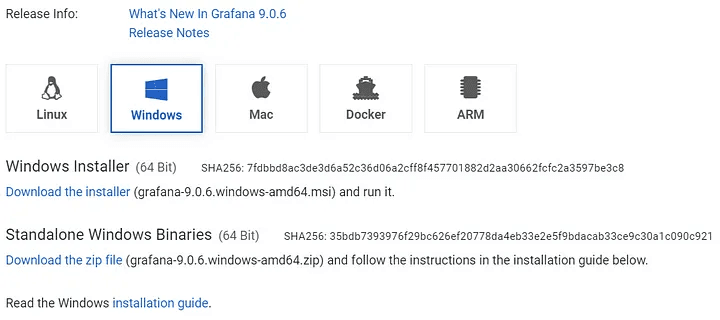
Overview of how to download and install different versions of Grafana on different operating systems.
grafana.com
Run “grafana-server.exe” in the bin folder to start the server and browse to http://localhost:3000
Add a data source from the home dashboard of Grafana and select Influxdb as data source type. Enter the name of the data source, URL and the name of the InfluxDB database and click on Save & test.
An acknowledgment saying “Data Source is working” will be displayed.
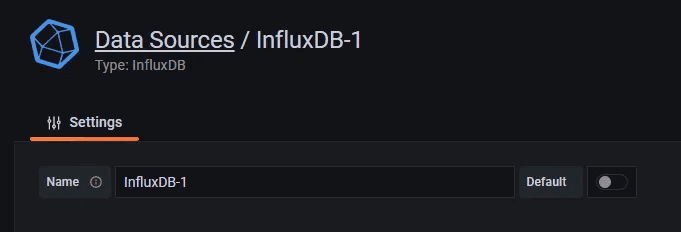
Adding InFluxDB as the Data Source type
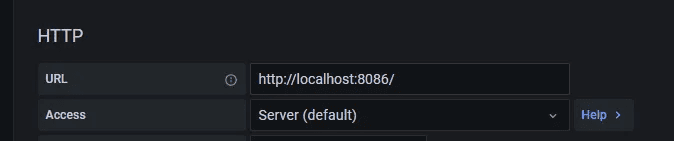
Enter the name of the URL
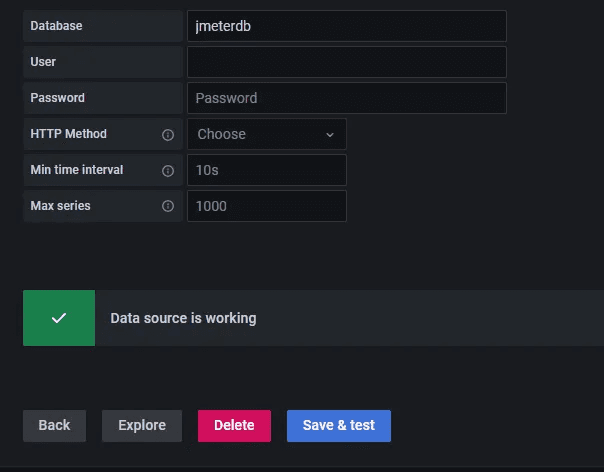
Select the Database
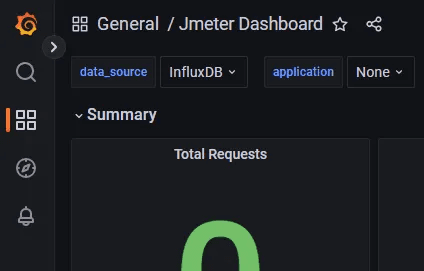
Import a dashboard from navigation panel on the left and enter dashboard ID as “5496”. You can also search for different dashboards available on:
https://grafana.com/grafana/dashboards/
Dashboards
Browse a library of official and community-built dashboards.
grafana.com
After importing the dashboard, select the data source you just made.
Import Dashboard
Run JMeter:
We need to run JMeter for further process and to acquire Real-Time Monitoring.
Running JMeter for Data Metrics
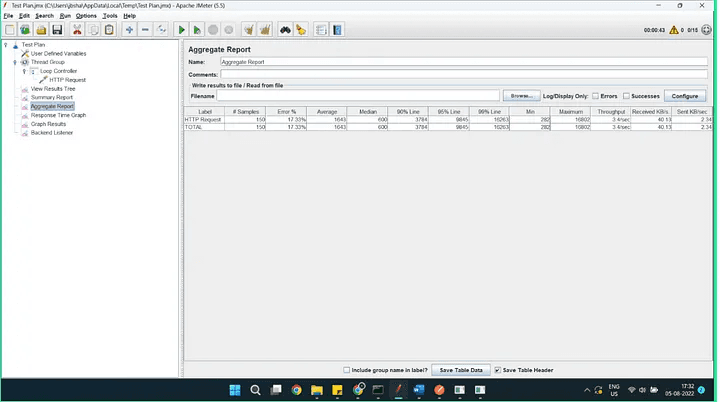
After running the JMeter, we get the Aggregate Report and its data metrics.
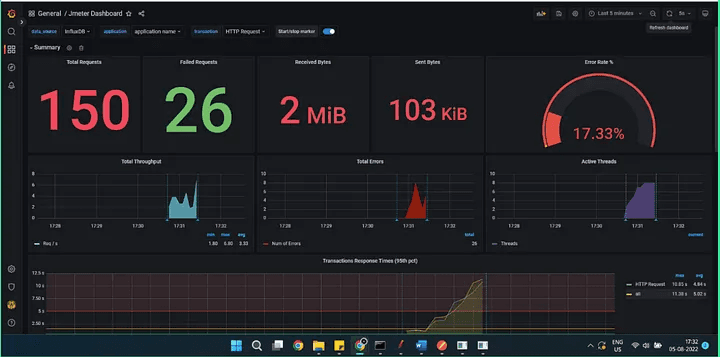
Real-Time Monitoring with JMeter
This was the process of Load Testing and Real-Time Monitoring with JMeter, InFluxDB, and Grafana mentioned above. I hope you find this informative enough to move forward with your project.
Thank You!!!
Through this article, you will get to know about load testing using JMeter along with InfluxDB and Grafana. How the setup is done with the installation process mentioned below.
Load testing can be defined as the process of software testing in which the application is tested under specific expected load. For this purpose, we will first need to install JMeter. Real-time monitoring is the process of collecting and storing performance metrics for data as it traverses your network.
Contents:
Setting up JMeter on Windows
Creating a Test Plan
InfluxDB Installation and Setup
Grafana Installation
Run JMeter.
Setting up JMeter on Windows
Prerequisites: Java — Check it with the “java -version” command on your command prompt.
Downloading JMeter:
1. Visit this link and download the zip folder.
2. Extract the contents of the zip folder and navigate to “jmeter.bat” in the bin folder and open it. You can always open JMeter GUI this way by opening jmeter.bat file
Creating a Test Plan:
It is comparatively easy to create a test plan using available templates. We will use a Simple HTTP request template to load test the API.
Navigate to File >> Templates… in your JMeter GUI. Select “Simple HTTP Request” from the drop-down list. And click on Create button at the bottom
Drop-down Menu
Fill in the necessary details and click on Create.
After successfully creating a template, we will be adding a Loop Controller, Sampler, and a few Listeners to our test plan and also setting up the thread properties.
Adding a Loop Controller: Add a loop controller by right-clicking on your thread group (as shown in the fig. below). Do the necessary changes.
Loop Controller
Thread Properties: Click on “Thread Group” from the left panel and make the necessary changes.
Thread Group
Adding a Sampler: Our template comes with an “HTTP Request” sampler. You just need to drag it under the loop controller (as shown in the above fig.) If you want, you can add a sampler just like we added the loop controller. Click on the “HTTP Request” sampler from the left panel.
HTTP Request Sampler
Adding listeners: Add the required listeners like backend listener, Results tree, and Aggregate Graph
Configure the Backend Listener: The backend listener is required to pass the summary data to InfluxDb database.
Select “InfluxdbBackendListenerClient” from the dropdown list.
Change the value of the Influxdb URL to: http://localhost:8086/write?db=jmeterdb(Note: jmeterdb is the name of the database in my InfluxDB. You can give any random name here, but make sure to create the InfluxDb database with the same name later.)
Passes the summary data to InFluxDB Database
With this, we have made all the necessary changes from the JMeter side required for Influxdb integration.
InfluxDB Installation and Setup
InfluxDB is a time-series database designed to handle high write and query loads. It is an integral component of the TICK stack. It is meant to be used as a backing store for any use case involving large amounts of timestamped data.
I’ve used Influxdb Version 1.8.10. You can download it from this link, Download the OSS Binary files for Windows.
Unzip the contents and navigate to the “influd.exe” file. Run the file to start the server.
Run “influx.exe” from the same folder to open CLI.
Run the following commands in influxdb CLI to create and use a database that will listen to the responses provided by JMeter.
Create database jmeterdb (Note: I have named my database as jmeterdb. You can give any random name but remember to give the same name in the JMeter Backend Listener URL.)
Use jmeterdb
With this, your InfluxDB is ready to listen to the JMeter responses.
Connected to the Server
Grafana Installation
https://grafana.com/grafana/download?platform=windows&edition=oss
Overview of how to download and install different versions of Grafana on different operating systems.
grafana.com
Run “grafana-server.exe” in the bin folder to start the server and browse to http://localhost:3000
Add a data source from the home dashboard of Grafana and select Influxdb as data source type. Enter the name of the data source, URL and the name of the InfluxDB database and click on Save & test.
An acknowledgment saying “Data Source is working” will be displayed.
Adding InFluxDB as the Data Source type
Enter the name of the URL
Select the Database
Import a dashboard from navigation panel on the left and enter dashboard ID as “5496”. You can also search for different dashboards available on:
https://grafana.com/grafana/dashboards/
Dashboards
Browse a library of official and community-built dashboards.
grafana.com
After importing the dashboard, select the data source you just made.
Import Dashboard
Run JMeter:
We need to run JMeter for further process and to acquire Real-Time Monitoring.
Running JMeter for Data Metrics
After running the JMeter, we get the Aggregate Report and its data metrics.
Real-Time Monitoring with JMeter
This was the process of Load Testing and Real-Time Monitoring with JMeter, InFluxDB, and Grafana mentioned above. I hope you find this informative enough to move forward with your project.
Thank You!!!