
Connecting Grafana to CloudWatch for Monitoring
Contents:
Introduction
Installation of Grafana
1. Create AWS Account.
2. Search for EC2 Service
3. Create Instances
4. Start the Grafana Server
Integration of Grafana with AWS EC2
1. IAM policy
2. Choose CloudWatch Service
3. Select Service
4. Add Datasource CloudWatch
5. Select Graph and Metrics
Basically, Grafana is an open-source program used for analytics and visualization. No matter where your data is kept, you can examine, validate, and display it with Grafana. Simply said, it offers several tools that may transform the data in your database into stunning graphs and visualizations.
The major features of Grafana are as follows:
Visualize
Alerts
Open source
Unify
Explore logs
Display dashboards
Create and share reports
In this article, we’ll concentrate on setting up Grafana on Ubuntu with AWS EC2 and integrating it with CloudWatch to monitor system performance and cut costs.
So, let’s begin with the installation of Grafana!!
You must first have a valid AWS account. I’m going to assume you already have one, but if not, click this link to make one.
https://aws.amazon.com/console/
AWS Management Console
Everything you need to access and manage the AWS Cloud - in one web interface Get additional help with support plans…
aws.amazon.com
2. Following account creation, you may see the AWS dashboard as shown below:
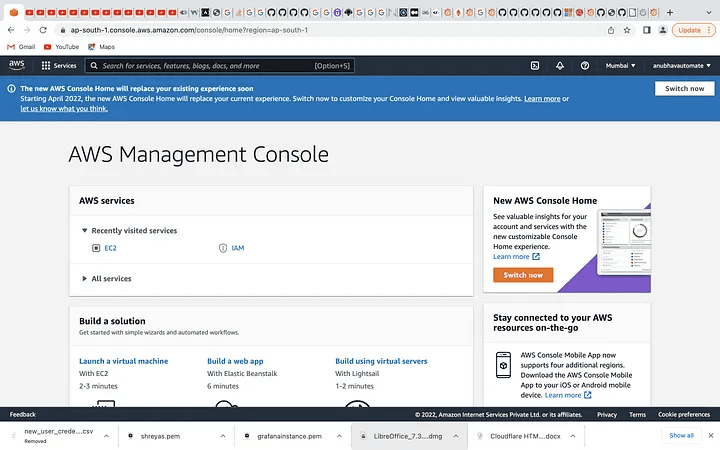
AWS Dashboard
3. You may now access the EC2 Dashboard by clicking on the AWS EC2 service after searching for it in the search box.
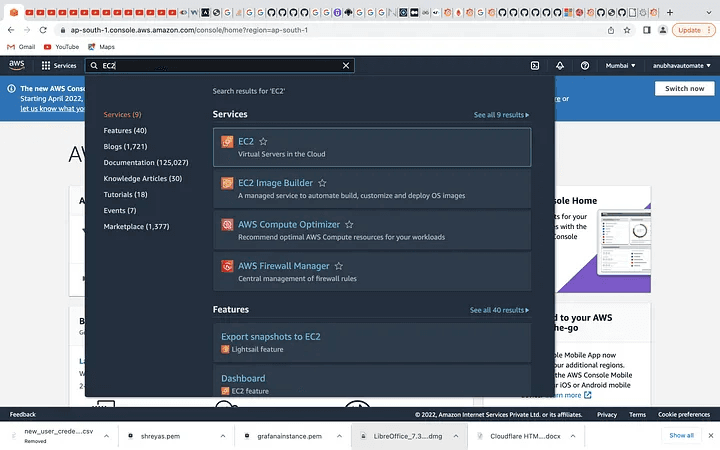
Click on the EC2 Service above
4. There are currently no instances active in the EC2 dashboard. I have multiple instances that I’ve generated on the Dashboard. The steps listed below must be followed in order to create an instance:
a. Choose an Amazon Machine Image (AMI)
b. Choose an Instance Type.
c. Configure Instance Details.
d. Add Storage. (30 GB)
e. Add Tags. (optional)
f. Configure Security Group.
g. Review Instance Launch and Select Key Pair.
Launch the instance after storing the key pair file (per file) in a safe location. Your newly created instance will appear on the EC2 dashboard. When it gets to the running state, it is first in the pending state. It’s accessible to you.
NOTE: Do not share the “pem file” with anyone.
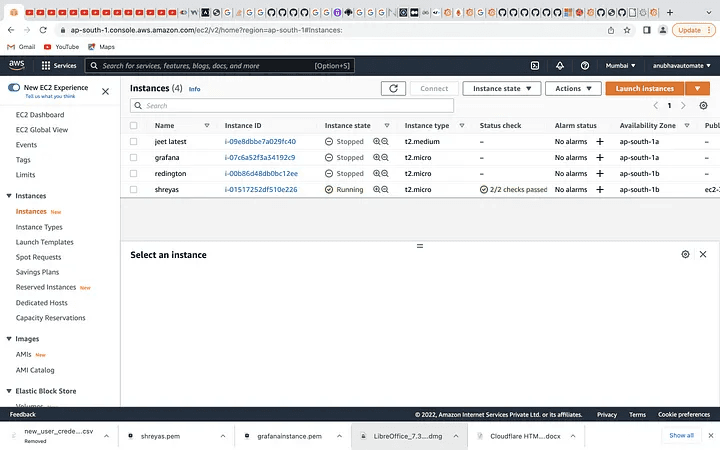
Select an Instance you created
5. You need to SSH into your most recent instance right now. Run the following command in your terminal from the location where you have your pem file to do this.
ssh -i “Your pem key” ubuntu@your_pubilcIPV4address
6. You must provide a few commands for Grafana installation as soon as you enter the instance. The EC2 instructions to enter are listed below:
ubuntu@ip-172–31–42–33:~$ sudo wget https://s3-us-west-2.amazonaws.com/grafana-releases/release/grafana_5.2.4_amd64.deb
ubuntu@ip-172–31–42–33:~$ sudo apt-get install -y adduser libfontconfig
ubuntu@ip-172–31–42–33:~$ sudo dpkg -i grafana_5.2.4_amd64.deb
7. Next step is that we need to modify our /etc/apt/sources.list file by adding a line to the bottom of it:
ubuntu@ip-172–31–42–33:~$ sudo nano /etc/apt/sources.list
Scroll down all the way to the bottom using your down-arrow key. Add the following line at the bottom:
deb https://packagecloud.io/grafana/stable/debian/ stretch main
Press CTRL+X and hit Y to confirm to save the file.
8. Now we need to add the Package Cloud key. This will allow us to install signed packages.
ubuntu@ip-172–31–42–33:~$ curl https://packagecloud.io/gpg.key | sudo apt-key add -
9. Now finally let’s see if we have everything successfully installed by using the following commands:
ubuntu@ip-172–31–42–33:~$ sudo apt-get update
ubuntu@ip-172–31–42–33:~$ sudo apt-get install grafana
10. Now, Start the Grafana Server by executing the following commands:
ubuntu@ip-172–31–42–33:~$ sudo systemctl start grafana-server
We can check that the server is running as expected by executing the following command:
ubuntu@ip-172–31–42–33:~$ sudo systemctl status grafana-server
=> Your Grafana server is finally ready!!
Open your Web Browser and enter the IP of your server followed by port 3000, like for example http://YourEC2ServerID:3000
11. You should then be able to see the Grafana Login Window.
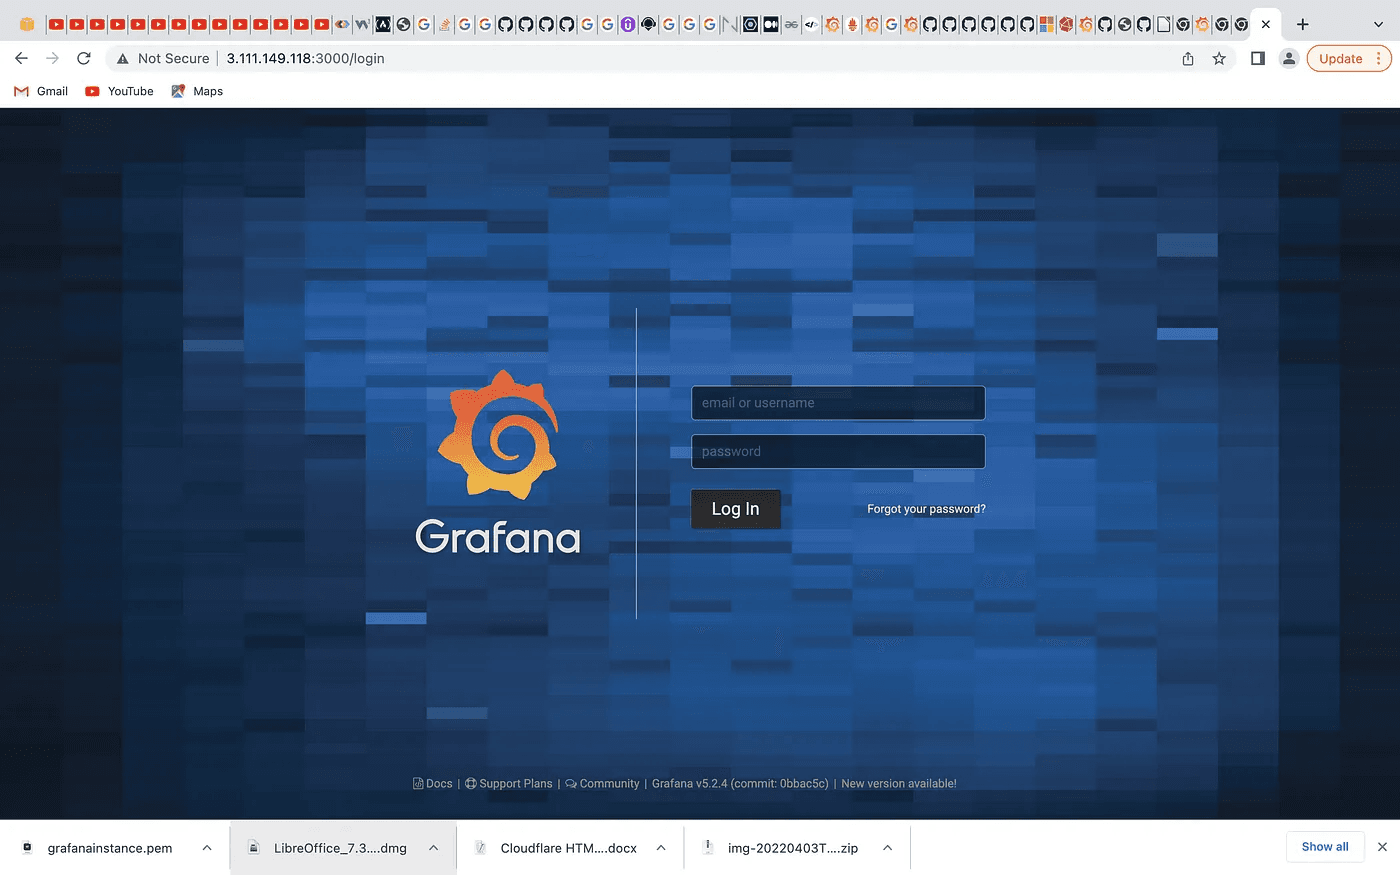
Grafana Server login Page
12. You must now add your admin or user credentials and log in. You will then be requested to update your Grafana password.
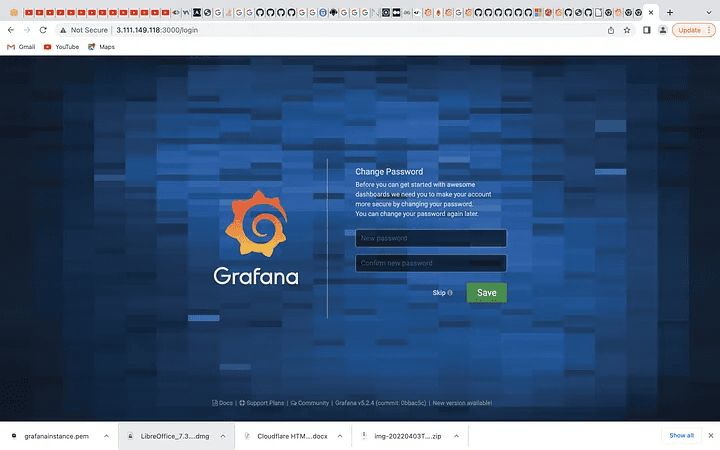
Add credentials as Admin/User and login into the Account
13. Save your new password now, and Grafana will display the dashboard as seen below:
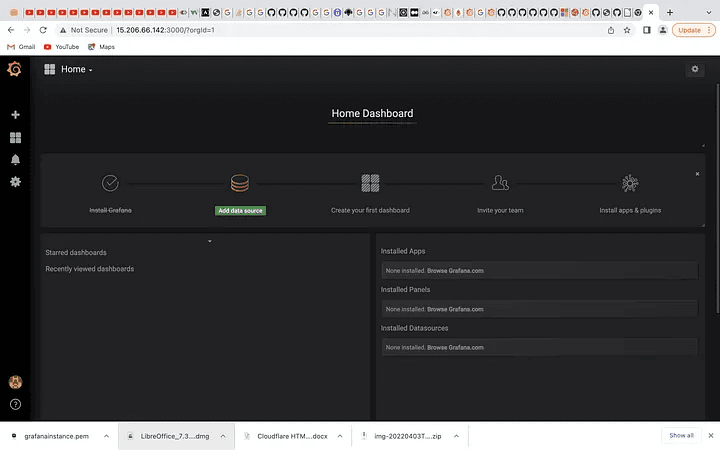
Grafana Dashboard
Finally, we will be integrating Grafana with AWS using the following steps:
You must first create an IAM policy from AWS since Grafana requires integration with AWS. Therefore, let’s create an IAM policy. Go to the AWS console and type IAM into the top search box. The sample photo is shown below.
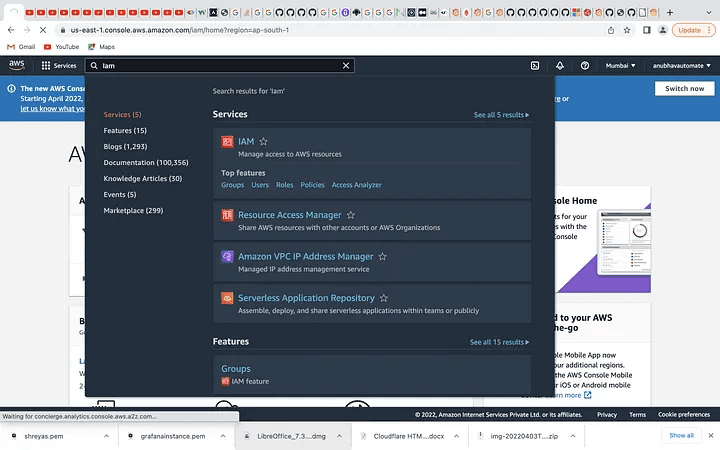
Create an IAM policy from the AWS dashboard
2. Now, as soon as you click on IAM you will the get IAM dashboard. Below is the snapshot.
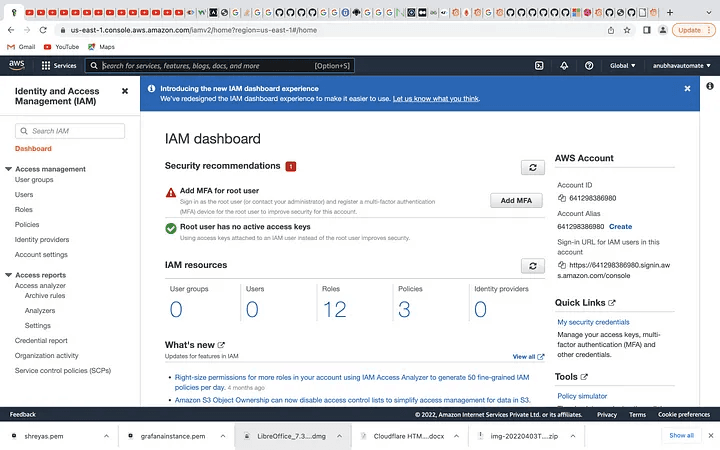
IAM Dashboard
3. Thereafter, you need to create an IAM policy. So, you can click on Policies present in the left panel. Below is the sample.
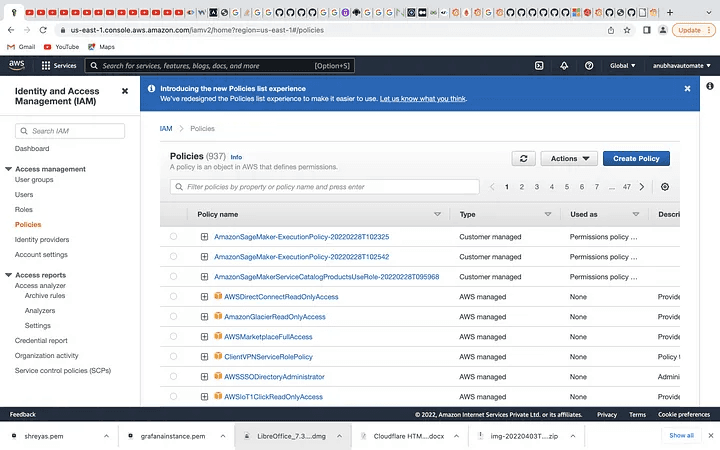
Policies
4. To grant Grafana read access for the CloudWatch metric, you must now choose to Create policy. There is a window below.
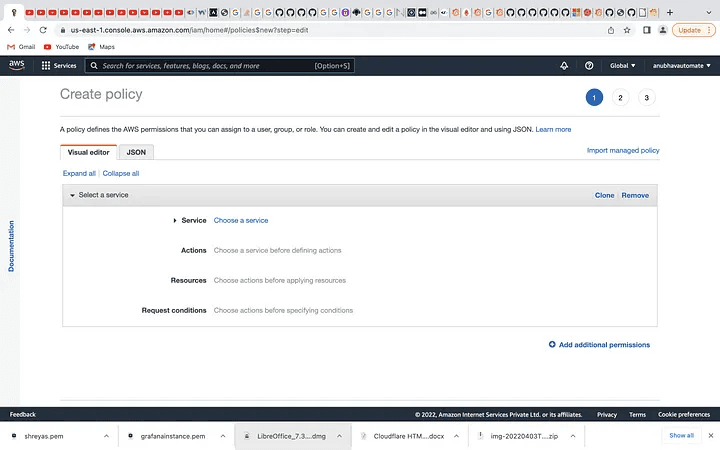
Create a policy
5. Then, choose CloudWatch from the list of services, then Action to perform the action on Grafana, as shown below.
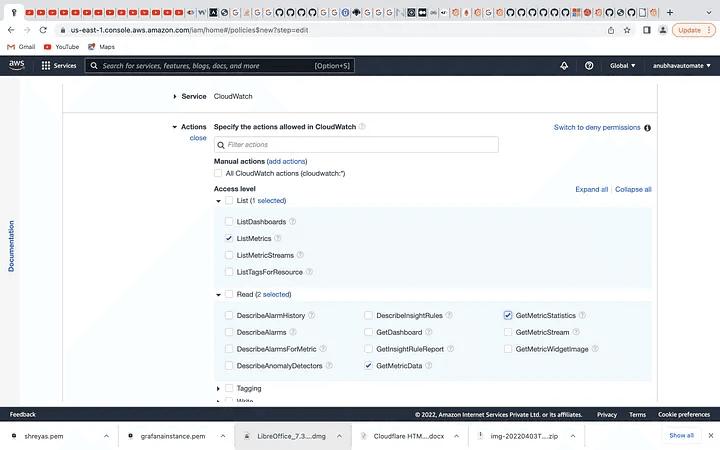
Choose a service named CloudWatch
6. You must now evaluate your newly generated policy and give it a name similar to the one below.
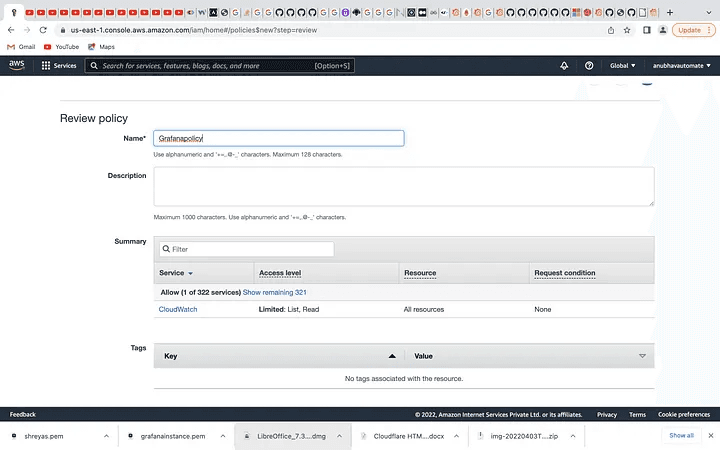
Review the Policy
7. In order to create an IAM role, click role in the left panel of the IAM dashboard. This will bring up a list of all available IAM roles, as seen in the image below.
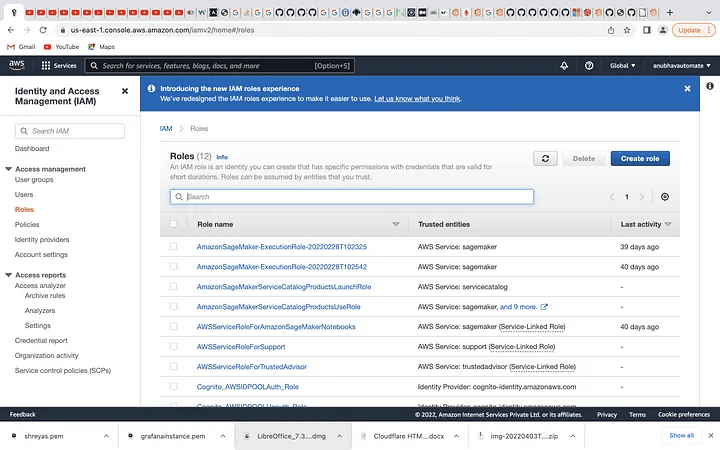
Create an IAM role
8. Now move to Create role and give it a click, you will get something like the below.
After An IAM role is created
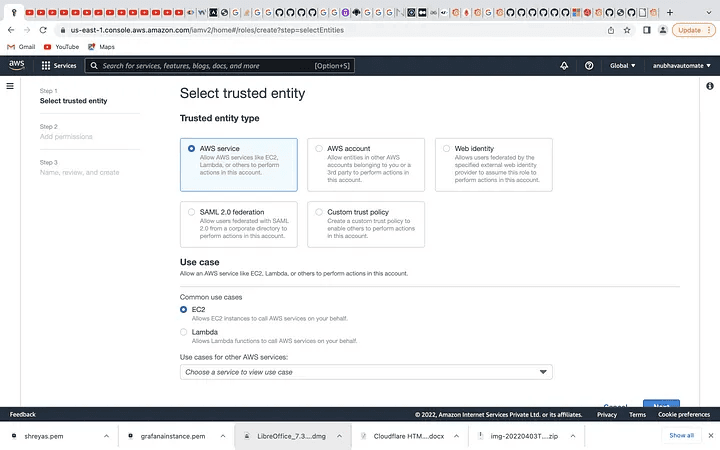
9. The next step is to choose Next after selecting AWS service and EC2 from the Use case. You must now add a role name and a permit as shown below.
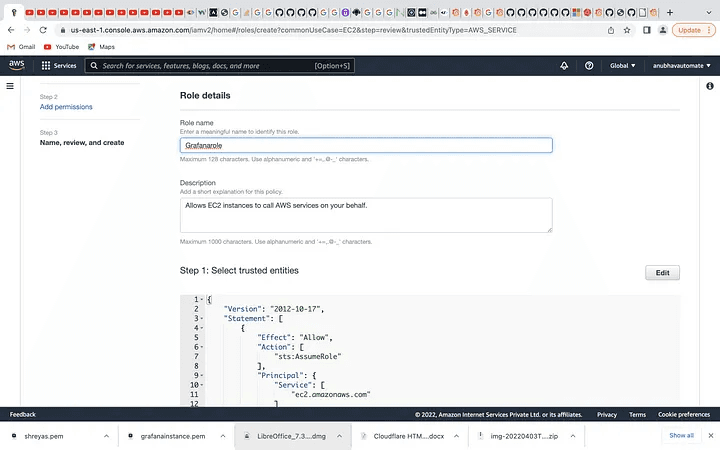
Select AWS and EC2 Services
10. Now in Add permission you need to search for the policy you created above. In my case, my IAM policy name is Grafanapolicy. So, add your policy like below sample snapshot.
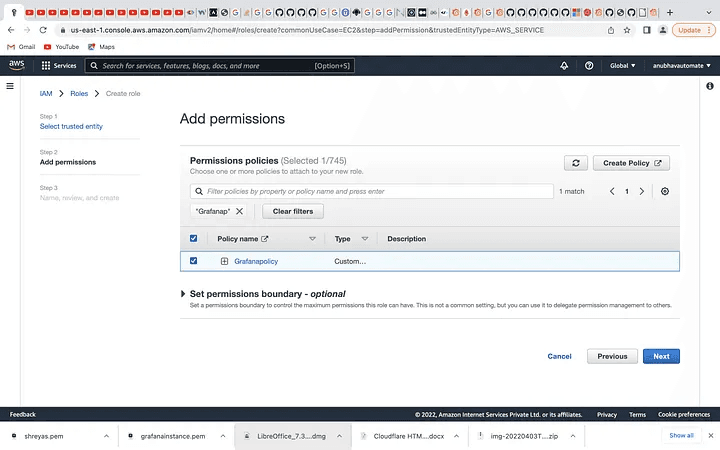
Add Permissions
11. Now, you can click on Next do the review of your role, and click on Create role. Below is the sample snapshot.
12. You will be able to see the role you created in the IAM Roles below.
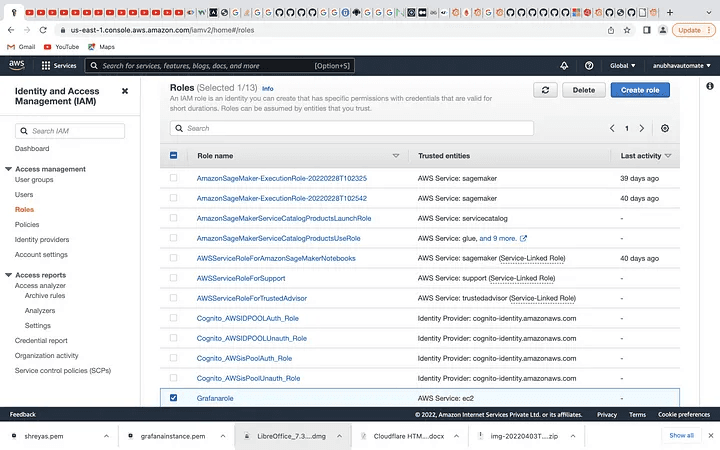
The role you created will appear here
13. As a result, you must now establish an IAM user who has access to the IAM role and IAM policy you just created. Consequently, choose Users from the left side on the IAM dashboard and then click Add User.
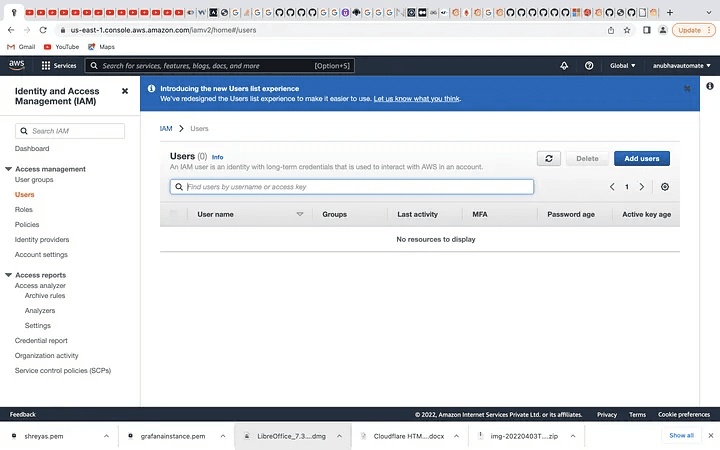
Create an IAM user
14. Now give a name to your IAM user and provide other necessary information and click on Next: Permission like below.
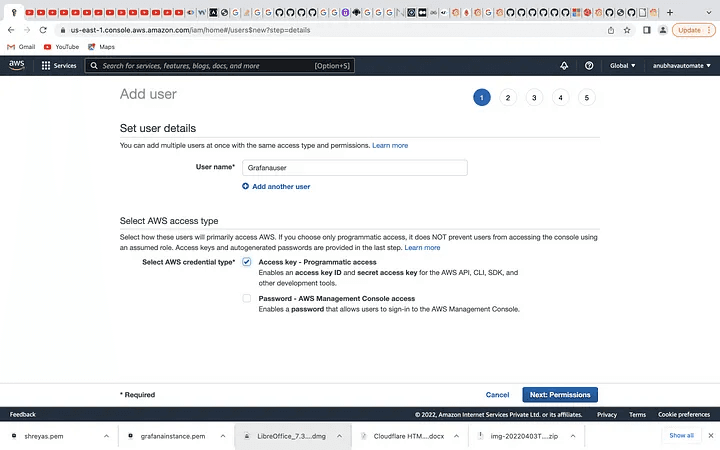
Provide a name for it
15. By selecting Attach existing policies directly and looking for the IAM policy you generated, as shown in the sample screenshot below, you may now attach the permission.
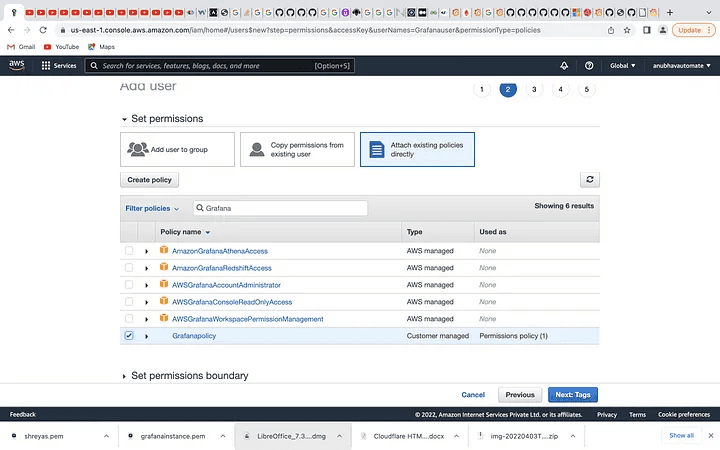
Attach the policies you created before
16. Now click on Next: Tags >> click on Review and click on Create user.
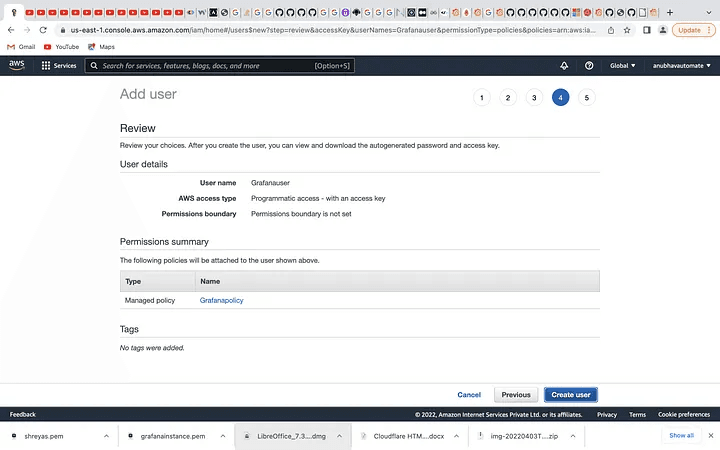
Review and create the User
17. Now go to the EC2 dashboard and select your recently created instance and do the same as the sample snapshot.
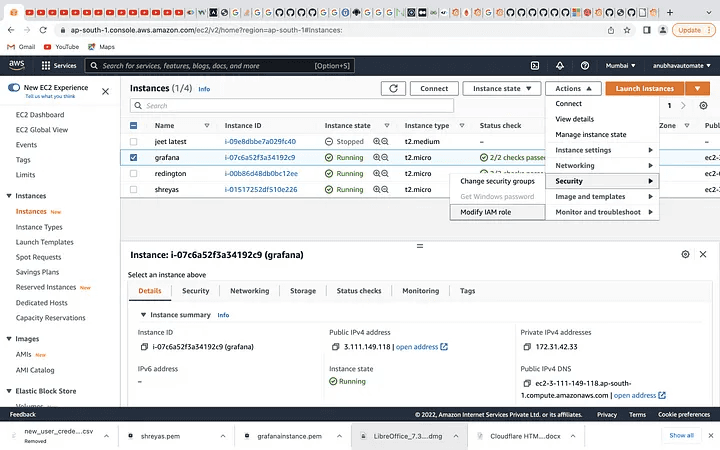
EC2 Dashboard
18. Then, in Modify IAM role, you must choose the IAM role you have recently established and click save as seen below. The most fascinating items are now available on Grafana.
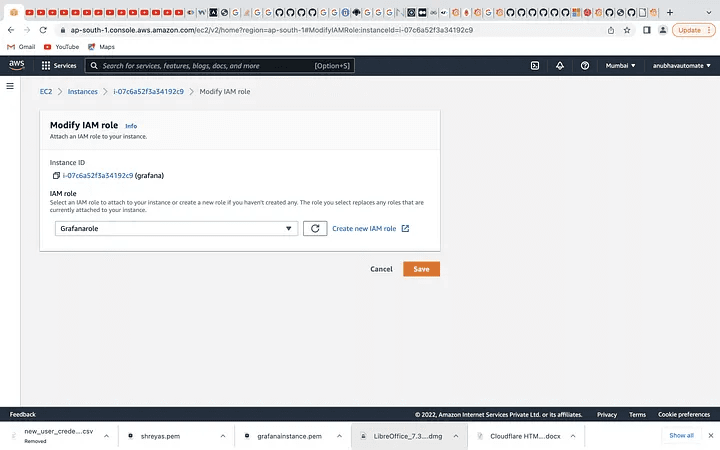
Now you can get the most interesting things on Grafana.
19. As a result, go to the Grafana dashboard, choose Add Datasource to add a data source, name the dashboard, and then choose CloudWatch from the Type box.
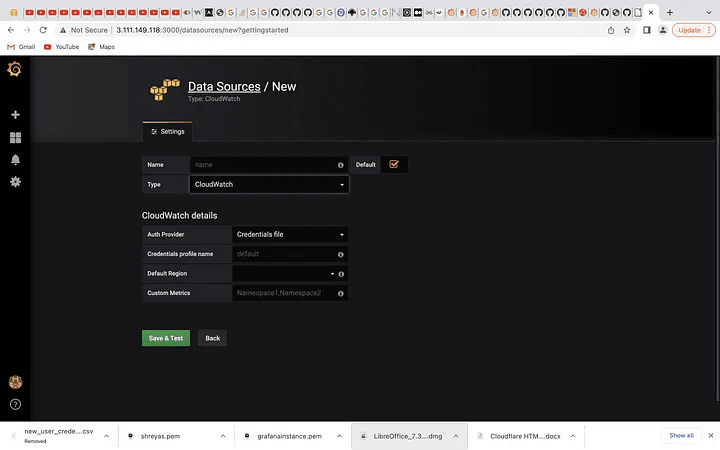
Add Datasource and select CloudWatch
20. Give the CloudWatch information as shown in the sample snapshot below, then click save and test. A notification such as Data source is working will appear. If you receive a different message, there is a problem. Follow this blog closely, then.
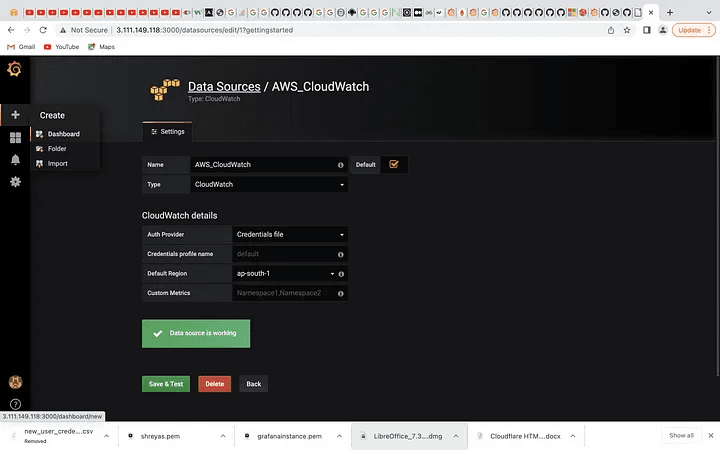
You will get a Message Data Source is Working
21. Once you’ve completed this step, it’s time to explore Grafana’s most intriguing insights via AWS CloudWatch. As a result, click the “+” symbol in the left panel, choose Dashboard, and then choose the Graph option to get a screen similar to the one below.
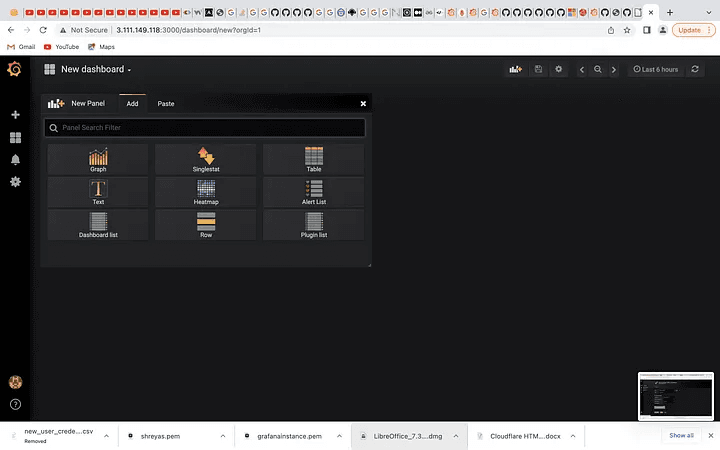
To view the most interesting insights from Grafana, Select Graphs
22. After selecting the Graph option you will get the below snapshot. Then from the panel title select the Edit option like below.
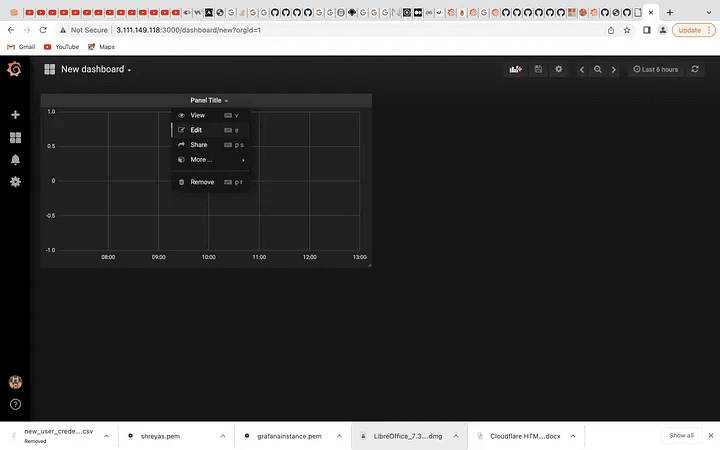
New Dashboard to select Metrics
23. Thereafter you will be able to get the below screen, where you need to select Metrics.
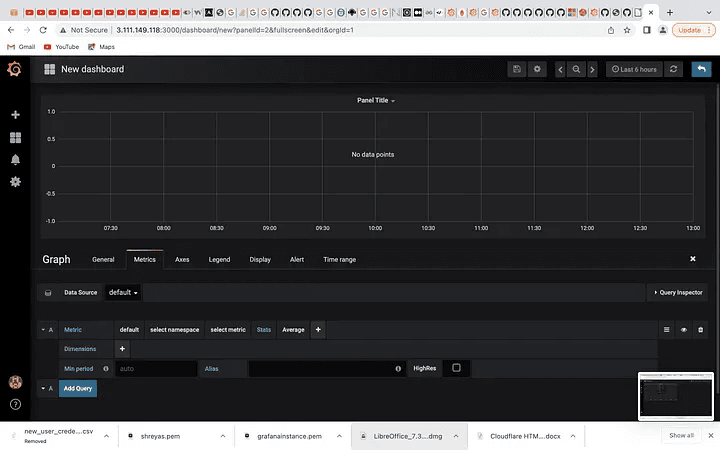
Add Metrics
24. You may now see your desired metrics; In my case, I want to view the CPU Utilization of my EC2 instance. I selected my area, namespace, and metric and then I asked for the average statistics. I then chose my instance ID, and there you have it! You’ll see the graph look something like this:
The graph we get after all the Metrics selected
25. Now, after getting this graph we want to set it in the dashboard. So, click on the save button and give the name to this graph like below.
Save the graph for future Purposes
26. Now you will be able to see the graph on the dashboard like below.
The Graph appears on the Dashboard
So, that’s pretty much all. Procedure by which we connected to CloudWatch by installing Grafana on Ubuntu and utilizing AWS EC2. I hope this was enough informative for everyone’s processes.
I hope this article was informative and provided you with the details you required. If you have any questions while reading the blog, message me on Instagram or LinkedIn.For any kind of work related to DevOps, Site Reliability you can contact me at helpmeanubhav@gmail.com
Thank You…
Contents:
Introduction
Installation of Grafana
1. Create AWS Account.
2. Search for EC2 Service
3. Create Instances
4. Start the Grafana Server
Integration of Grafana with AWS EC2
1. IAM policy
2. Choose CloudWatch Service
3. Select Service
4. Add Datasource CloudWatch
5. Select Graph and Metrics
Basically, Grafana is an open-source program used for analytics and visualization. No matter where your data is kept, you can examine, validate, and display it with Grafana. Simply said, it offers several tools that may transform the data in your database into stunning graphs and visualizations.
The major features of Grafana are as follows:
Visualize
Alerts
Open source
Unify
Explore logs
Display dashboards
Create and share reports
In this article, we’ll concentrate on setting up Grafana on Ubuntu with AWS EC2 and integrating it with CloudWatch to monitor system performance and cut costs.
So, let’s begin with the installation of Grafana!!
You must first have a valid AWS account. I’m going to assume you already have one, but if not, click this link to make one.
https://aws.amazon.com/console/
AWS Management Console
Everything you need to access and manage the AWS Cloud - in one web interface Get additional help with support plans…
aws.amazon.com
2. Following account creation, you may see the AWS dashboard as shown below:
AWS Dashboard
3. You may now access the EC2 Dashboard by clicking on the AWS EC2 service after searching for it in the search box.
Click on the EC2 Service above
4. There are currently no instances active in the EC2 dashboard. I have multiple instances that I’ve generated on the Dashboard. The steps listed below must be followed in order to create an instance:
a. Choose an Amazon Machine Image (AMI)
b. Choose an Instance Type.
c. Configure Instance Details.
d. Add Storage. (30 GB)
e. Add Tags. (optional)
f. Configure Security Group.
g. Review Instance Launch and Select Key Pair.
Launch the instance after storing the key pair file (per file) in a safe location. Your newly created instance will appear on the EC2 dashboard. When it gets to the running state, it is first in the pending state. It’s accessible to you.
NOTE: Do not share the “pem file” with anyone.
Select an Instance you created
5. You need to SSH into your most recent instance right now. Run the following command in your terminal from the location where you have your pem file to do this.
ssh -i “Your pem key” ubuntu@your_pubilcIPV4address
6. You must provide a few commands for Grafana installation as soon as you enter the instance. The EC2 instructions to enter are listed below:
ubuntu@ip-172–31–42–33:~$ sudo wget https://s3-us-west-2.amazonaws.com/grafana-releases/release/grafana_5.2.4_amd64.deb
ubuntu@ip-172–31–42–33:~$ sudo apt-get install -y adduser libfontconfig
ubuntu@ip-172–31–42–33:~$ sudo dpkg -i grafana_5.2.4_amd64.deb
7. Next step is that we need to modify our /etc/apt/sources.list file by adding a line to the bottom of it:
ubuntu@ip-172–31–42–33:~$ sudo nano /etc/apt/sources.list
Scroll down all the way to the bottom using your down-arrow key. Add the following line at the bottom:
deb https://packagecloud.io/grafana/stable/debian/ stretch main
Press CTRL+X and hit Y to confirm to save the file.
8. Now we need to add the Package Cloud key. This will allow us to install signed packages.
ubuntu@ip-172–31–42–33:~$ curl https://packagecloud.io/gpg.key | sudo apt-key add -
9. Now finally let’s see if we have everything successfully installed by using the following commands:
ubuntu@ip-172–31–42–33:~$ sudo apt-get update
ubuntu@ip-172–31–42–33:~$ sudo apt-get install grafana
10. Now, Start the Grafana Server by executing the following commands:
ubuntu@ip-172–31–42–33:~$ sudo systemctl start grafana-server
We can check that the server is running as expected by executing the following command:
ubuntu@ip-172–31–42–33:~$ sudo systemctl status grafana-server
=> Your Grafana server is finally ready!!
Open your Web Browser and enter the IP of your server followed by port 3000, like for example http://YourEC2ServerID:3000
11. You should then be able to see the Grafana Login Window.
Grafana Server login Page
12. You must now add your admin or user credentials and log in. You will then be requested to update your Grafana password.
Add credentials as Admin/User and login into the Account
13. Save your new password now, and Grafana will display the dashboard as seen below:
Grafana Dashboard
Finally, we will be integrating Grafana with AWS using the following steps:
You must first create an IAM policy from AWS since Grafana requires integration with AWS. Therefore, let’s create an IAM policy. Go to the AWS console and type IAM into the top search box. The sample photo is shown below.
Create an IAM policy from the AWS dashboard
2. Now, as soon as you click on IAM you will the get IAM dashboard. Below is the snapshot.
IAM Dashboard
3. Thereafter, you need to create an IAM policy. So, you can click on Policies present in the left panel. Below is the sample.
Policies
4. To grant Grafana read access for the CloudWatch metric, you must now choose to Create policy. There is a window below.
Create a policy
5. Then, choose CloudWatch from the list of services, then Action to perform the action on Grafana, as shown below.
Choose a service named CloudWatch
6. You must now evaluate your newly generated policy and give it a name similar to the one below.
Review the Policy
7. In order to create an IAM role, click role in the left panel of the IAM dashboard. This will bring up a list of all available IAM roles, as seen in the image below.
Create an IAM role
8. Now move to Create role and give it a click, you will get something like the below.
After An IAM role is created
9. The next step is to choose Next after selecting AWS service and EC2 from the Use case. You must now add a role name and a permit as shown below.
Select AWS and EC2 Services
10. Now in Add permission you need to search for the policy you created above. In my case, my IAM policy name is Grafanapolicy. So, add your policy like below sample snapshot.
Add Permissions
11. Now, you can click on Next do the review of your role, and click on Create role. Below is the sample snapshot.
12. You will be able to see the role you created in the IAM Roles below.
The role you created will appear here
13. As a result, you must now establish an IAM user who has access to the IAM role and IAM policy you just created. Consequently, choose Users from the left side on the IAM dashboard and then click Add User.
Create an IAM user
14. Now give a name to your IAM user and provide other necessary information and click on Next: Permission like below.
Provide a name for it
15. By selecting Attach existing policies directly and looking for the IAM policy you generated, as shown in the sample screenshot below, you may now attach the permission.
Attach the policies you created before
16. Now click on Next: Tags >> click on Review and click on Create user.
Review and create the User
17. Now go to the EC2 dashboard and select your recently created instance and do the same as the sample snapshot.
EC2 Dashboard
18. Then, in Modify IAM role, you must choose the IAM role you have recently established and click save as seen below. The most fascinating items are now available on Grafana.
Now you can get the most interesting things on Grafana.
19. As a result, go to the Grafana dashboard, choose Add Datasource to add a data source, name the dashboard, and then choose CloudWatch from the Type box.
Add Datasource and select CloudWatch
20. Give the CloudWatch information as shown in the sample snapshot below, then click save and test. A notification such as Data source is working will appear. If you receive a different message, there is a problem. Follow this blog closely, then.
You will get a Message Data Source is Working
21. Once you’ve completed this step, it’s time to explore Grafana’s most intriguing insights via AWS CloudWatch. As a result, click the “+” symbol in the left panel, choose Dashboard, and then choose the Graph option to get a screen similar to the one below.
To view the most interesting insights from Grafana, Select Graphs
22. After selecting the Graph option you will get the below snapshot. Then from the panel title select the Edit option like below.
New Dashboard to select Metrics
23. Thereafter you will be able to get the below screen, where you need to select Metrics.
Add Metrics
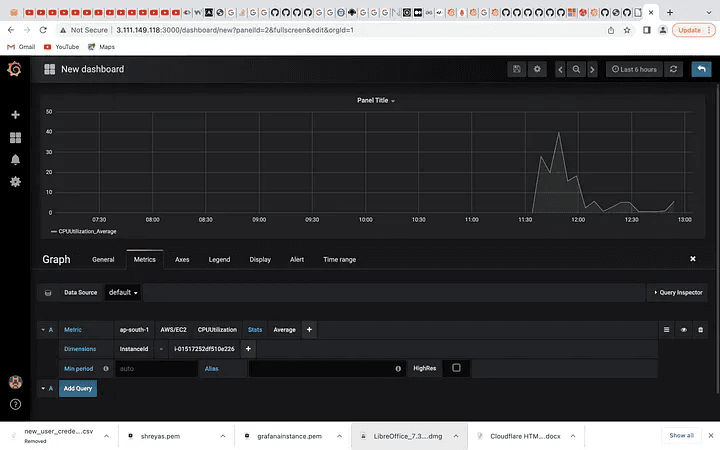
24. You may now see your desired metrics; In my case, I want to view the CPU Utilization of my EC2 instance. I selected my area, namespace, and metric and then I asked for the average statistics. I then chose my instance ID, and there you have it! You’ll see the graph look something like this:
The graph we get after all the Metrics selected
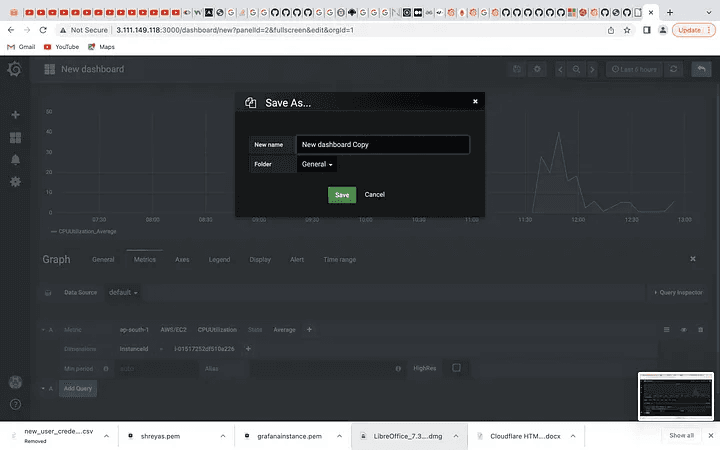
25. Now, after getting this graph we want to set it in the dashboard. So, click on the save button and give the name to this graph like below.
Save the graph for future Purposes
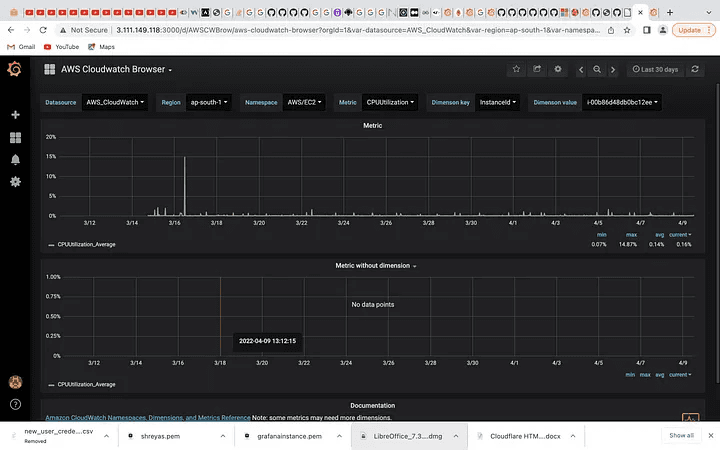
26. Now you will be able to see the graph on the dashboard like below.
The Graph appears on the Dashboard
So, that’s pretty much all. Procedure by which we connected to CloudWatch by installing Grafana on Ubuntu and utilizing AWS EC2. I hope this was enough informative for everyone’s processes.
I hope this article was informative and provided you with the details you required. If you have any questions while reading the blog, message me on Instagram or LinkedIn.For any kind of work related to DevOps, Site Reliability you can contact me at helpmeanubhav@gmail.com
Thank You…
Contents:
Introduction
Installation of Grafana
1. Create AWS Account.
2. Search for EC2 Service
3. Create Instances
4. Start the Grafana Server
Integration of Grafana with AWS EC2
1. IAM policy
2. Choose CloudWatch Service
3. Select Service
4. Add Datasource CloudWatch
5. Select Graph and Metrics
Basically, Grafana is an open-source program used for analytics and visualization. No matter where your data is kept, you can examine, validate, and display it with Grafana. Simply said, it offers several tools that may transform the data in your database into stunning graphs and visualizations.
The major features of Grafana are as follows:
Visualize
Alerts
Open source
Unify
Explore logs
Display dashboards
Create and share reports
In this article, we’ll concentrate on setting up Grafana on Ubuntu with AWS EC2 and integrating it with CloudWatch to monitor system performance and cut costs.
So, let’s begin with the installation of Grafana!!
You must first have a valid AWS account. I’m going to assume you already have one, but if not, click this link to make one.
https://aws.amazon.com/console/
AWS Management Console
Everything you need to access and manage the AWS Cloud - in one web interface Get additional help with support plans…
aws.amazon.com
2. Following account creation, you may see the AWS dashboard as shown below:
AWS Dashboard
3. You may now access the EC2 Dashboard by clicking on the AWS EC2 service after searching for it in the search box.
Click on the EC2 Service above
4. There are currently no instances active in the EC2 dashboard. I have multiple instances that I’ve generated on the Dashboard. The steps listed below must be followed in order to create an instance:
a. Choose an Amazon Machine Image (AMI)
b. Choose an Instance Type.
c. Configure Instance Details.
d. Add Storage. (30 GB)
e. Add Tags. (optional)
f. Configure Security Group.
g. Review Instance Launch and Select Key Pair.
Launch the instance after storing the key pair file (per file) in a safe location. Your newly created instance will appear on the EC2 dashboard. When it gets to the running state, it is first in the pending state. It’s accessible to you.
NOTE: Do not share the “pem file” with anyone.
Select an Instance you created
5. You need to SSH into your most recent instance right now. Run the following command in your terminal from the location where you have your pem file to do this.
ssh -i “Your pem key” ubuntu@your_pubilcIPV4address
6. You must provide a few commands for Grafana installation as soon as you enter the instance. The EC2 instructions to enter are listed below:
ubuntu@ip-172–31–42–33:~$ sudo wget https://s3-us-west-2.amazonaws.com/grafana-releases/release/grafana_5.2.4_amd64.deb
ubuntu@ip-172–31–42–33:~$ sudo apt-get install -y adduser libfontconfig
ubuntu@ip-172–31–42–33:~$ sudo dpkg -i grafana_5.2.4_amd64.deb
7. Next step is that we need to modify our /etc/apt/sources.list file by adding a line to the bottom of it:
ubuntu@ip-172–31–42–33:~$ sudo nano /etc/apt/sources.list
Scroll down all the way to the bottom using your down-arrow key. Add the following line at the bottom:
deb https://packagecloud.io/grafana/stable/debian/ stretch main
Press CTRL+X and hit Y to confirm to save the file.
8. Now we need to add the Package Cloud key. This will allow us to install signed packages.
ubuntu@ip-172–31–42–33:~$ curl https://packagecloud.io/gpg.key | sudo apt-key add -
9. Now finally let’s see if we have everything successfully installed by using the following commands:
ubuntu@ip-172–31–42–33:~$ sudo apt-get update
ubuntu@ip-172–31–42–33:~$ sudo apt-get install grafana
10. Now, Start the Grafana Server by executing the following commands:
ubuntu@ip-172–31–42–33:~$ sudo systemctl start grafana-server
We can check that the server is running as expected by executing the following command:
ubuntu@ip-172–31–42–33:~$ sudo systemctl status grafana-server
=> Your Grafana server is finally ready!!
Open your Web Browser and enter the IP of your server followed by port 3000, like for example http://YourEC2ServerID:3000
11. You should then be able to see the Grafana Login Window.
Grafana Server login Page
12. You must now add your admin or user credentials and log in. You will then be requested to update your Grafana password.
Add credentials as Admin/User and login into the Account
13. Save your new password now, and Grafana will display the dashboard as seen below:
Grafana Dashboard
Finally, we will be integrating Grafana with AWS using the following steps:
You must first create an IAM policy from AWS since Grafana requires integration with AWS. Therefore, let’s create an IAM policy. Go to the AWS console and type IAM into the top search box. The sample photo is shown below.
Create an IAM policy from the AWS dashboard
2. Now, as soon as you click on IAM you will the get IAM dashboard. Below is the snapshot.
IAM Dashboard
3. Thereafter, you need to create an IAM policy. So, you can click on Policies present in the left panel. Below is the sample.
Policies
4. To grant Grafana read access for the CloudWatch metric, you must now choose to Create policy. There is a window below.
Create a policy
5. Then, choose CloudWatch from the list of services, then Action to perform the action on Grafana, as shown below.
Choose a service named CloudWatch
6. You must now evaluate your newly generated policy and give it a name similar to the one below.
Review the Policy
7. In order to create an IAM role, click role in the left panel of the IAM dashboard. This will bring up a list of all available IAM roles, as seen in the image below.
Create an IAM role
8. Now move to Create role and give it a click, you will get something like the below.
After An IAM role is created
9. The next step is to choose Next after selecting AWS service and EC2 from the Use case. You must now add a role name and a permit as shown below.
Select AWS and EC2 Services
10. Now in Add permission you need to search for the policy you created above. In my case, my IAM policy name is Grafanapolicy. So, add your policy like below sample snapshot.
Add Permissions
11. Now, you can click on Next do the review of your role, and click on Create role. Below is the sample snapshot.
12. You will be able to see the role you created in the IAM Roles below.
The role you created will appear here
13. As a result, you must now establish an IAM user who has access to the IAM role and IAM policy you just created. Consequently, choose Users from the left side on the IAM dashboard and then click Add User.
Create an IAM user
14. Now give a name to your IAM user and provide other necessary information and click on Next: Permission like below.
Provide a name for it
15. By selecting Attach existing policies directly and looking for the IAM policy you generated, as shown in the sample screenshot below, you may now attach the permission.
Attach the policies you created before
16. Now click on Next: Tags >> click on Review and click on Create user.
Review and create the User
17. Now go to the EC2 dashboard and select your recently created instance and do the same as the sample snapshot.
EC2 Dashboard
18. Then, in Modify IAM role, you must choose the IAM role you have recently established and click save as seen below. The most fascinating items are now available on Grafana.
Now you can get the most interesting things on Grafana.
19. As a result, go to the Grafana dashboard, choose Add Datasource to add a data source, name the dashboard, and then choose CloudWatch from the Type box.
Add Datasource and select CloudWatch
20. Give the CloudWatch information as shown in the sample snapshot below, then click save and test. A notification such as Data source is working will appear. If you receive a different message, there is a problem. Follow this blog closely, then.
You will get a Message Data Source is Working
21. Once you’ve completed this step, it’s time to explore Grafana’s most intriguing insights via AWS CloudWatch. As a result, click the “+” symbol in the left panel, choose Dashboard, and then choose the Graph option to get a screen similar to the one below.
To view the most interesting insights from Grafana, Select Graphs
22. After selecting the Graph option you will get the below snapshot. Then from the panel title select the Edit option like below.
New Dashboard to select Metrics
23. Thereafter you will be able to get the below screen, where you need to select Metrics.
Add Metrics
24. You may now see your desired metrics; In my case, I want to view the CPU Utilization of my EC2 instance. I selected my area, namespace, and metric and then I asked for the average statistics. I then chose my instance ID, and there you have it! You’ll see the graph look something like this:
The graph we get after all the Metrics selected
25. Now, after getting this graph we want to set it in the dashboard. So, click on the save button and give the name to this graph like below.
Save the graph for future Purposes
26. Now you will be able to see the graph on the dashboard like below.
The Graph appears on the Dashboard
So, that’s pretty much all. Procedure by which we connected to CloudWatch by installing Grafana on Ubuntu and utilizing AWS EC2. I hope this was enough informative for everyone’s processes.
I hope this article was informative and provided you with the details you required. If you have any questions while reading the blog, message me on Instagram or LinkedIn.For any kind of work related to DevOps, Site Reliability you can contact me at helpmeanubhav@gmail.com
Thank You…