
Office Scripting used with Power Automate Flow replacing Macros
In this blog, I will demonstrate how the competency report works. All of the logic which is utilized to generate the report is shown below.

Let’s get started with the stages involved in creating a competency tool.
Step 1: Get information from the form that we submitted. We can see that we added the Script “FinalScript Sales Operations” to the Run Script connector. As you can see in the image below, the employee and manager’s names are in string format. Following that, all responses are saved as a string, and we have typed all of the questions that appear in each competency.
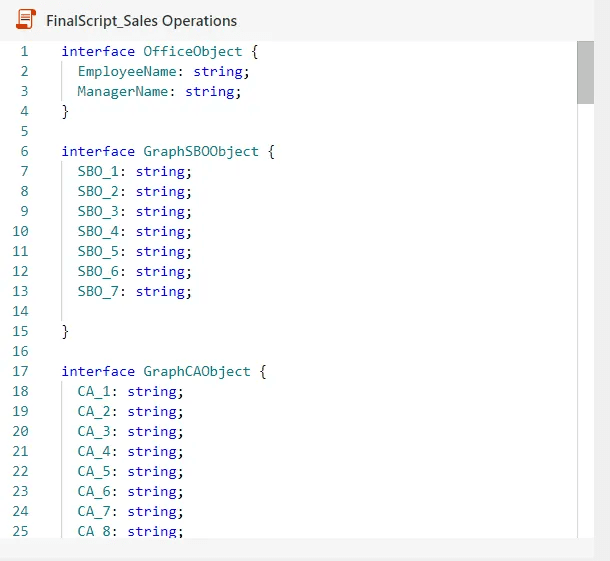
We have given the brief form of the questions here.
Now, because each competency has a different number of questions, we couldn’t figure out the total problem at first, but after some R&D, we came up with a solution that is the “Get Row” connector that we saw in a Microsoft Power Automate Flow. So the logic of that Get Row is to eventually obtain the FormID. We have now added these lines to our script in order to print the graph based on the responses we have got.
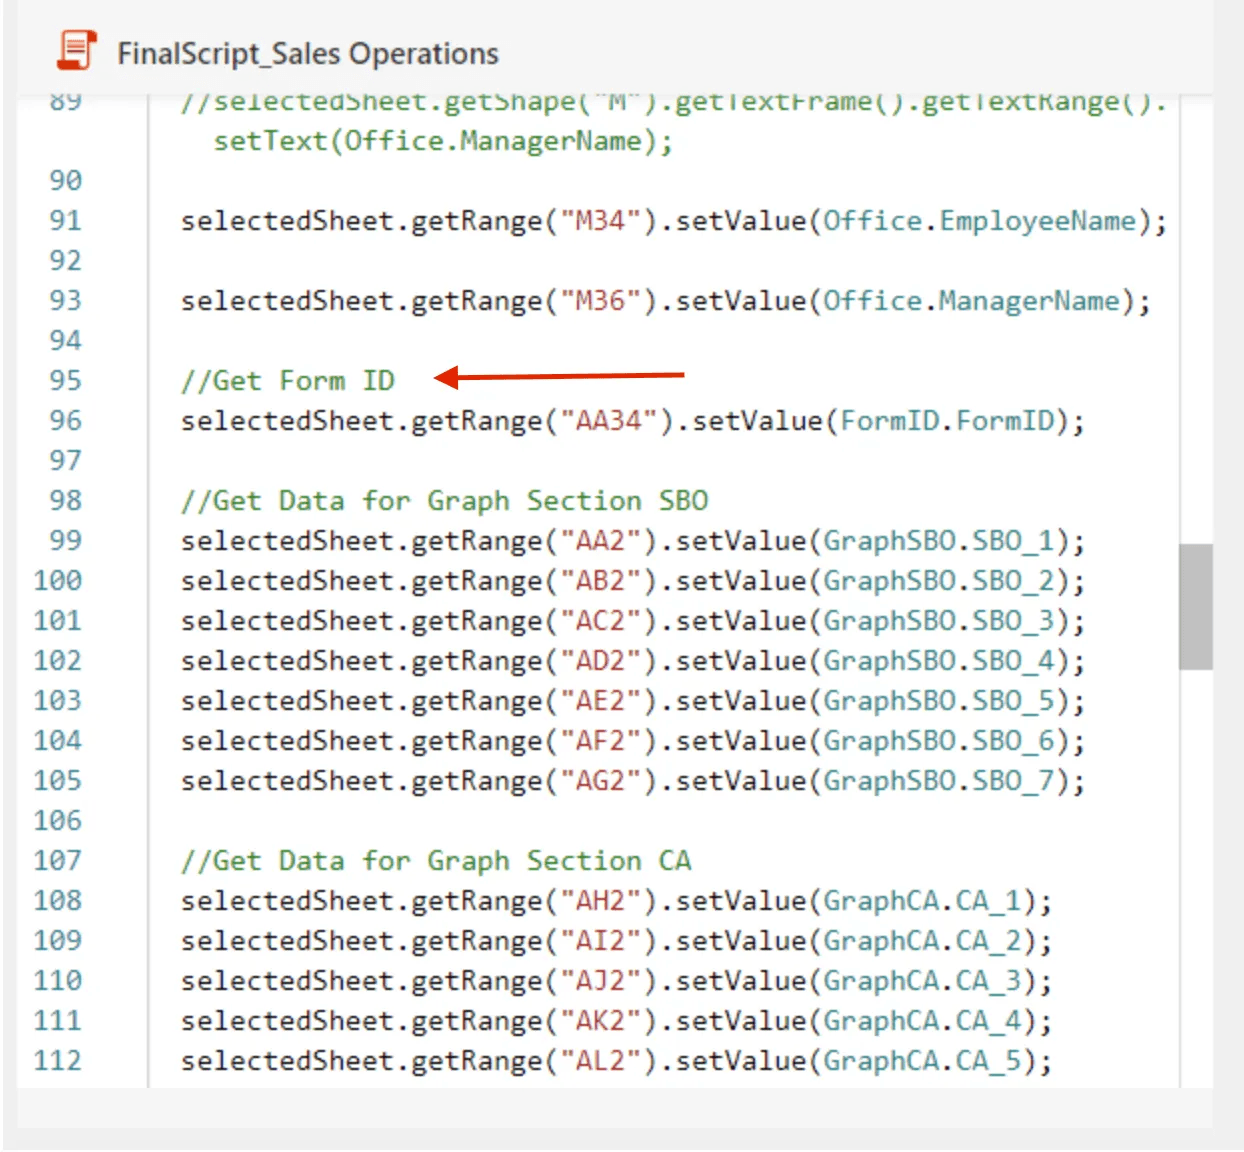
Displays form ID
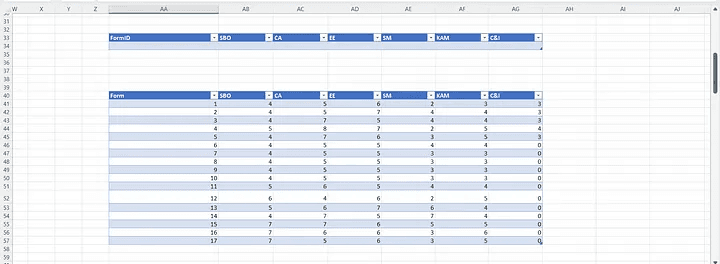
You can also view the FormID table.
Step 2: As you can see in the image below, there are two sections: Self and Manager. Employee and manager names must be printed in this section. So we devised a logic in which we included the cell number in the getRange function so that the employee and Manager’s names would print in that cell number, and that printed name would appear in the Self & Manager area.
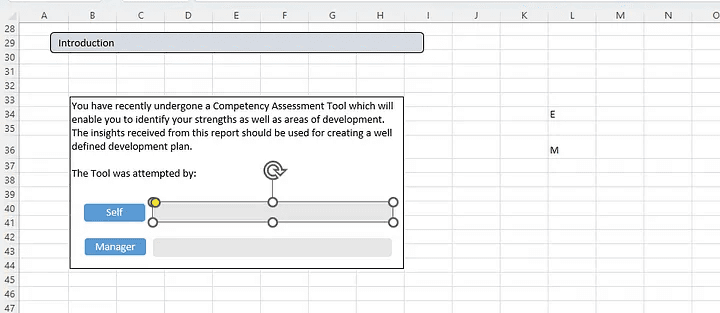
Image 1 depicts the Self & Manager portion
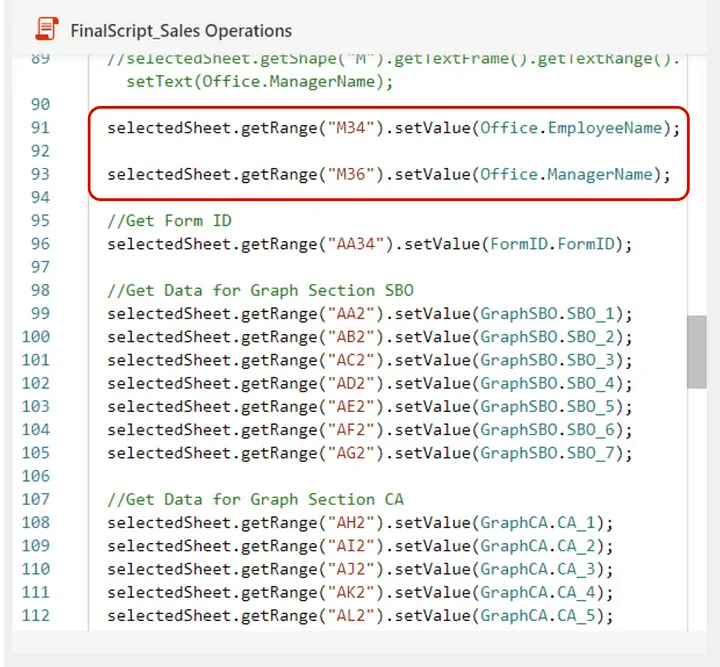
Image 2 displays a script
Step 3: As you can see in the figure below, there are three areas, and the competency names must be printed in each of them.
Step 4: To do this, we have created three tables for each. (As shown in the image below). Each section has a different range, therefore we added the if statement to print the Competency name in that cell based on the range. As shown in the example below, all of the names will be printed in the blue highlighted area. The same is true for the other two tables.
Step 5: Now in those 3 section names are for when single competency is printed but if more than one competency are printed then instead of “Strength” it will print as “Strengths”.
To do this, we ran some logic in the cell using the If statement. The statement will look something like this:
=IF (Q15=””,TRUE, FALSE). Now, in the right side table, the condition will look like this:-
=IF(ForEmergingStrength[@Competency]=FALSE,1,””),
and we will repeat this for all, with the sum written just below the table.
So, if the sum is greater than one, it will print “Strengths”; else, it will print “Strength”. We’ll do the same with the other one.
Step 6: Another logic in our Excel converts the Sometimes, Often, and Always as 1, 3, and 5. And the sum of one competency’s questions will be printed in a different table. As shown in the image below, this is possible. In the second table, we likewise used XLOOKUP to convert data.
Step 7: So all reasoning was included in the employee’s spreadsheet.
In the Manager’s Excel, we will accomplish the same thing as previously described. The quadrant Graph is an extra benefit in this. The competency’s name will also be printed in this section, as demonstrated in the figure below. We created the tables as previously explained. The competency names will be printed in the green highlighted section. These names will be reflected in the Quadrant Graph.
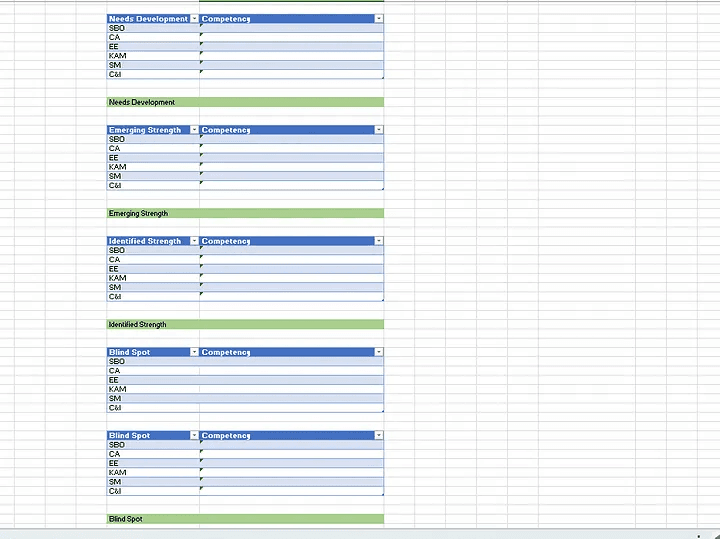
Image 1 shows a Table that we developed.
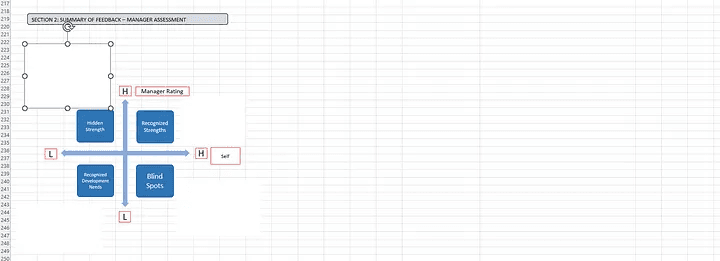
Image 2 depicts a Quadrant Graph.
This was the backend of the competency report that we built in the Power Automate flow, where we used logic to create a great tool.
I hope this blog was informative and provided you with the details you required. If you have any questions while reading the blog, message me on Instagram or LinkedIn. For any work related to Automation , Office Scripting, Power Automate Development you can contact me at helpmeanubhav@gmail.com .Special credits to my team member — Atharva and Divyam and Krisha.
Thank You…
In this blog, I will demonstrate how the competency report works. All of the logic which is utilized to generate the report is shown below.
Let’s get started with the stages involved in creating a competency tool.
Step 1: Get information from the form that we submitted. We can see that we added the Script “FinalScript Sales Operations” to the Run Script connector. As you can see in the image below, the employee and manager’s names are in string format. Following that, all responses are saved as a string, and we have typed all of the questions that appear in each competency.
We have given the brief form of the questions here.
Now, because each competency has a different number of questions, we couldn’t figure out the total problem at first, but after some R&D, we came up with a solution that is the “Get Row” connector that we saw in a Microsoft Power Automate Flow. So the logic of that Get Row is to eventually obtain the FormID. We have now added these lines to our script in order to print the graph based on the responses we have got.
Displays form ID
You can also view the FormID table.
Step 2: As you can see in the image below, there are two sections: Self and Manager. Employee and manager names must be printed in this section. So we devised a logic in which we included the cell number in the getRange function so that the employee and Manager’s names would print in that cell number, and that printed name would appear in the Self & Manager area.
Image 1 depicts the Self & Manager portion
Image 2 displays a script
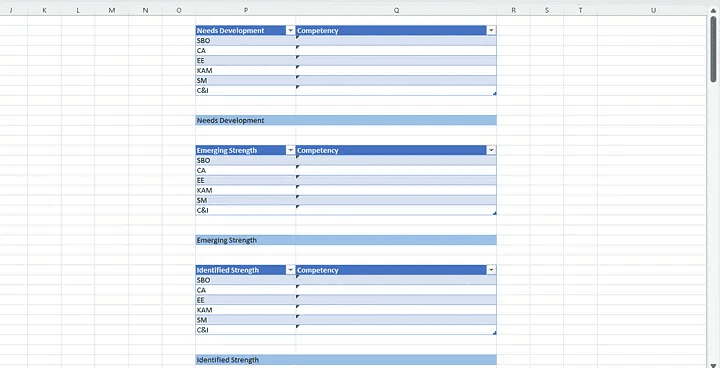
Step 3: As you can see in the figure below, there are three areas, and the competency names must be printed in each of them.
Step 4: To do this, we have created three tables for each. (As shown in the image below). Each section has a different range, therefore we added the if statement to print the Competency name in that cell based on the range. As shown in the example below, all of the names will be printed in the blue highlighted area. The same is true for the other two tables.
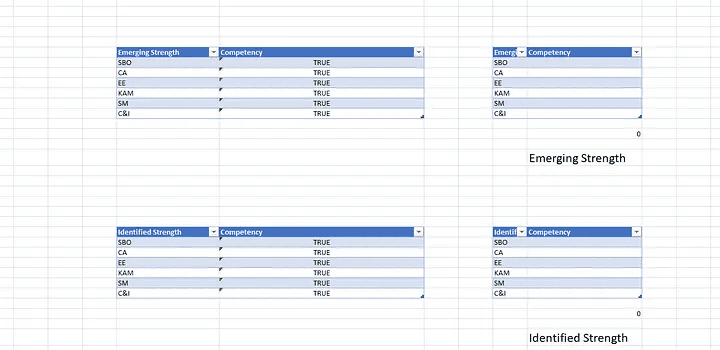
Step 5: Now in those 3 section names are for when single competency is printed but if more than one competency are printed then instead of “Strength” it will print as “Strengths”.
To do this, we ran some logic in the cell using the If statement. The statement will look something like this:
=IF (Q15=””,TRUE, FALSE). Now, in the right side table, the condition will look like this:-
=IF(ForEmergingStrength[@Competency]=FALSE,1,””),
and we will repeat this for all, with the sum written just below the table.
So, if the sum is greater than one, it will print “Strengths”; else, it will print “Strength”. We’ll do the same with the other one.
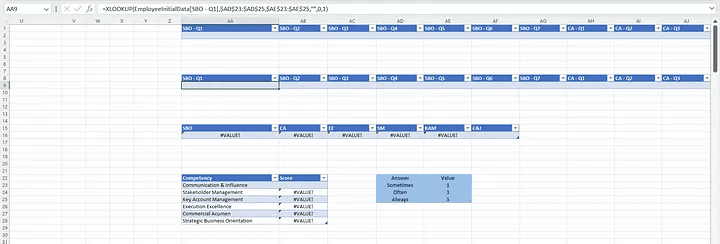
Step 6: Another logic in our Excel converts the Sometimes, Often, and Always as 1, 3, and 5. And the sum of one competency’s questions will be printed in a different table. As shown in the image below, this is possible. In the second table, we likewise used XLOOKUP to convert data.
Step 7: So all reasoning was included in the employee’s spreadsheet.
In the Manager’s Excel, we will accomplish the same thing as previously described. The quadrant Graph is an extra benefit in this. The competency’s name will also be printed in this section, as demonstrated in the figure below. We created the tables as previously explained. The competency names will be printed in the green highlighted section. These names will be reflected in the Quadrant Graph.
Image 1 shows a Table that we developed.
Image 2 depicts a Quadrant Graph.
This was the backend of the competency report that we built in the Power Automate flow, where we used logic to create a great tool.
I hope this blog was informative and provided you with the details you required. If you have any questions while reading the blog, message me on Instagram or LinkedIn. For any work related to Automation , Office Scripting, Power Automate Development you can contact me at helpmeanubhav@gmail.com .Special credits to my team member — Atharva and Divyam and Krisha.
Thank You…
In this blog, I will demonstrate how the competency report works. All of the logic which is utilized to generate the report is shown below.
Let’s get started with the stages involved in creating a competency tool.
Step 1: Get information from the form that we submitted. We can see that we added the Script “FinalScript Sales Operations” to the Run Script connector. As you can see in the image below, the employee and manager’s names are in string format. Following that, all responses are saved as a string, and we have typed all of the questions that appear in each competency.
We have given the brief form of the questions here.
Now, because each competency has a different number of questions, we couldn’t figure out the total problem at first, but after some R&D, we came up with a solution that is the “Get Row” connector that we saw in a Microsoft Power Automate Flow. So the logic of that Get Row is to eventually obtain the FormID. We have now added these lines to our script in order to print the graph based on the responses we have got.
Displays form ID
You can also view the FormID table.
Step 2: As you can see in the image below, there are two sections: Self and Manager. Employee and manager names must be printed in this section. So we devised a logic in which we included the cell number in the getRange function so that the employee and Manager’s names would print in that cell number, and that printed name would appear in the Self & Manager area.
Image 1 depicts the Self & Manager portion
Image 2 displays a script
Step 3: As you can see in the figure below, there are three areas, and the competency names must be printed in each of them.
Step 4: To do this, we have created three tables for each. (As shown in the image below). Each section has a different range, therefore we added the if statement to print the Competency name in that cell based on the range. As shown in the example below, all of the names will be printed in the blue highlighted area. The same is true for the other two tables.
Step 5: Now in those 3 section names are for when single competency is printed but if more than one competency are printed then instead of “Strength” it will print as “Strengths”.
To do this, we ran some logic in the cell using the If statement. The statement will look something like this:
=IF (Q15=””,TRUE, FALSE). Now, in the right side table, the condition will look like this:-
=IF(ForEmergingStrength[@Competency]=FALSE,1,””),
and we will repeat this for all, with the sum written just below the table.
So, if the sum is greater than one, it will print “Strengths”; else, it will print “Strength”. We’ll do the same with the other one.
Step 6: Another logic in our Excel converts the Sometimes, Often, and Always as 1, 3, and 5. And the sum of one competency’s questions will be printed in a different table. As shown in the image below, this is possible. In the second table, we likewise used XLOOKUP to convert data.
Step 7: So all reasoning was included in the employee’s spreadsheet.
In the Manager’s Excel, we will accomplish the same thing as previously described. The quadrant Graph is an extra benefit in this. The competency’s name will also be printed in this section, as demonstrated in the figure below. We created the tables as previously explained. The competency names will be printed in the green highlighted section. These names will be reflected in the Quadrant Graph.
Image 1 shows a Table that we developed.
Image 2 depicts a Quadrant Graph.
This was the backend of the competency report that we built in the Power Automate flow, where we used logic to create a great tool.
I hope this blog was informative and provided you with the details you required. If you have any questions while reading the blog, message me on Instagram or LinkedIn. For any work related to Automation , Office Scripting, Power Automate Development you can contact me at helpmeanubhav@gmail.com .Special credits to my team member — Atharva and Divyam and Krisha.
Thank You…