Monitoring docker Containers and Logs via Grafana , Promtail ,Prometheus and Loki , sending alerts to slack
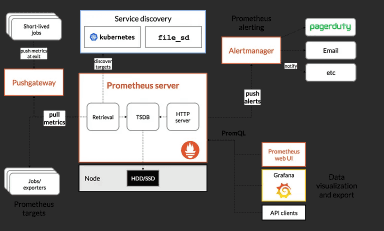
A monitoring and logging solution for Docker hosts and containers with Prometheus, Grafana, Loki, cAdvisor, NodeExporter, and alerting with AlertManager.
Prometheus :
Prometheus is a toolbox for monitoring and alerting. Prometheus is an excellent tool for recording solely numerical time series. It is appropriate for both machine-centric monitoring and monitoring of highly dynamic service-oriented architectures. Its support for multi-dimensional data collecting and querying is a particular asset in a world of microservices.
Grafana :
It is a data-visualization platform that allows users to see their data via charts and graphs that are unified into one dashboard for easier interpretation and understanding. Grafana is commonly used to monitor the performance of applications, networks, and infrastructure. It has the ability to integrate with a wide range of data sources.
Another key feature of Grafana is its ability to create alerts based on the data displayed in the dashboards. Users can define conditions that trigger an alert, such as a threshold being exceeded, and configure the alert to be sent via email, Slack, or other notification channels.
Loki :
Loki is a horizontally scalable, highly available, multi-tenant log aggregation system inspired by Prometheus. It does not index the contents of the logs, but rather a set of labels for each log stream. Loki takes a unique approach by only indexing the metadata rather than the full text of the log lines.
Promtail :
Promtail is an agent which ships the contents of local logs to a private Grafana Loki instance or Grafana Cloud. It is usually deployed to every machine that has applications needed to be monitored.
cAdvisor :
cAdvisor (Container Advisor) provides container users with an understanding of the resource usage and performance characteristics of their running containers. It is a running daemon that collects, aggregates, processes, and exports information about running containers. Specifically, for each container, it keeps resource isolation parameters, historical resource usage, histograms of complete historical resource usage, and network statistics. This data is exported by container and machine-wide. cAdvisor has native support for Docker containers.
NodeExporter :
Node Exporter is a Prometheus exporter for server-level and OS-level metrics with configurable metric collectors. It helps us in measuring various server resources such as RAM, disk space, and CPU utilization. Node exporter is a good solution to collect all the Linux server-related metrics and statistics for monitoring.
Alert Manager :
The Alertmanager handles alerts sent by client applications such as the Prometheus server. It takes care of deduplicating, grouping, and routing them to the correct receiver integration such as email, PagerDuty, or OpsGenie. It also takes care of silencing and inhibition of alerts.
The following docker. compose.yaml file will create the monitoring for the docker container using all the elements mentioned below.
version: "3"
networks:
monitor-net:
driver: bridge
volumes:
prometheus_data: {}
grafana_data: {}
services:
prometheus:
image: prom/prometheus:v2.38.0
container_name: prometheus
volumes:
- ./prometheus:/etc/prometheus
- prometheus_data:/prometheus
command:
- '--config.file=/etc/prometheus/prometheus.yml'
- '--storage.tsdb.path=/prometheus'
- '--web.console.libraries=/etc/prometheus/console_libraries'
- '--web.console.templates=/etc/prometheus/consoles'
- '--storage.tsdb.retention.time=200h'
- '--web.enable-lifecycle'
restart: always
expose:
- 9090
networks:
- monitor-net
labels:
org.label-schema.group: "monitoring"
alertmanager:
image: prom/alertmanager:v0.24.0
container_name: alertmanager
volumes:
- ./alertmanager:/etc/alertmanager
command:
- '--config.file=/etc/alertmanager/config.yml'
- '--storage.path=/alertmanager'
restart: always
expose:
- 9093
networks:
- monitor-net
labels:
org.label-schema.group: "monitoring"
nodeexporter:
image: prom/node-exporter:v1.3.1
container_name: nodeexporter
volumes:
- /proc:/host/proc:ro
- /sys:/host/sys:ro
- /:/rootfs:ro
command:
- '--path.procfs=/host/proc'
- '--path.rootfs=/rootfs'
- '--path.sysfs=/host/sys'
'--collector.filesystem.mount-points-
exclude=^/(sys|proc|dev|host|etc)($$|/)'
restart: always
expose:
- 9100
networks:
- monitor-net
labels:
org.label-schema.group: "monitoring"
loki:
image: grafana/loki:2.6.0
container_name: loki
volumes:
- ./loki/loki-config.yaml:/etc/loki/loki-config.yaml
command: -config.file=/etc/loki/loki-config.yaml
expose:
- 3100
restart: always
networks:
- monitor-net
promtail:
image: grafana/promtail:2.6.0
container_name: promtail
volumes:
- /var/run/docker.sock:/var/run/docker.sock
- /var/log:/var/log:ro
- ./loki/promtail-config.yaml:/etc/promtail/promtail-config.yaml
command: -config.file=/etc/promtail/promtail-config.yaml
restart: always
networks:
- monitor-net
cadvisor:
image: gcr.io/cadvisor/cadvisor:v0.45.0
container_name: cadvisor
privileged: true
devices:
- /dev/kmsg:/dev/kmsg
volumes:
- /:/rootfs:ro
- /var/run:/var/run:ro
- /sys:/sys:ro
- /var/lib/docker:/var/lib/docker:ro
#- /cgroup:/cgroup:ro #doesn't work on MacOS only for Linux
restart: always
expose:
- 8080
networks:
- monitor-net
labels:
org.label-schema.group: "monitoring"
grafana:
image: grafana/grafana:9.1.1
container_name: grafana
volumes:
- grafana_data:/var/lib/grafana
- ./grafana/provisioning/dashboards:/etc/grafana/provisioning/dashboards
- ./grafana/provisioning/datasources:/etc/grafana/provisioning/datasources
env_file:
- config
restart: always
expose:
- 3000
networks:
- monitor-net
labels:
org.label-schema.group: "monitoring"
pushgateway:
image: prom/pushgateway:v1.4.3
container_name: pushgateway
restart: always
expose:
- 9091
networks:
- monitor-net
labels:
org.label-schema.group: "monitoring"
caddy:
image: caddy:2.3.0
container_name: caddy
ports:
- "3000:3000"
- "9090:9090"
- "8080:8080"
- "9093:9093"
- "9091:9091"
- "3100:3100"
volumes:
- ./caddy:/etc/caddy
environment:
- ADMIN_USER=${ADMIN_USER:-admin}
- ADMIN_PASSWORD=${ADMIN_PASSWORD:-admin}
- ADMIN_PASSWORD_HASH=${ADMIN_PASSWORD_HASH:-
JDJhJDE0JE91S1FrN0Z0VEsyWmhrQVpON1VzdHVLSDkyWHdsN0xNbEZYdnNIZm1pb2d1blg4Y09mL0ZP}
restart: always
networks:
- monitor-net
labels:
org.label-schema.group: "monitoring"
Now, let’s discuss the content written in the above file.
Here, we are using a bridge named monitor-net. So, all components can talk to each other. We have defined two volumes named grafana_data and prometheus_data. For all components, we are using official docker images defined in services in the file.
For Prometheus, we are using prom/prometheus:v2.38.0 docker image. The container name will be Prometheus and it uses port number 9000. Volume prometheus_data will be mounted to /Prometheus in the container.
Same as all other components are configured and they have exposed different ports.
Now, run docker-compose up -d. it will create all containers and start them. As shown in the below images, go to a particular port for a specific service.
Prometheus: 9090
Grafana:3000
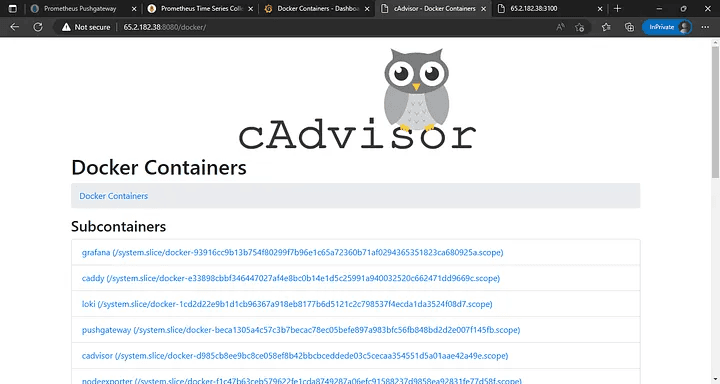
cAdvisor: 8080
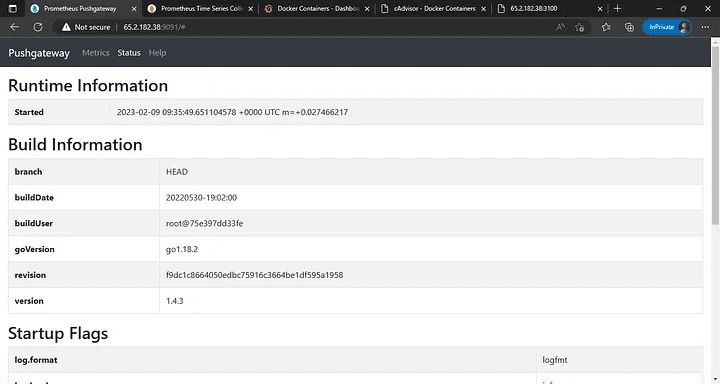
Prometheus push gateway: 9091
Now, let’s use Grafana to send a notification to Slack. Bear in mind that creating notifications in Grafana requires administrative privileges.
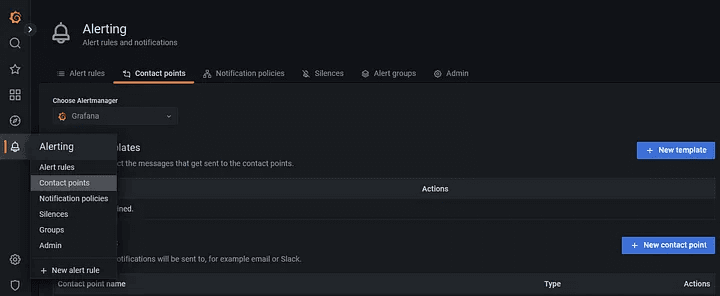
Step 1: To create the alert, we must first configure the contact points in Grafana. Go to the alerting section and select contact points. In our situation, we will configure Slack.
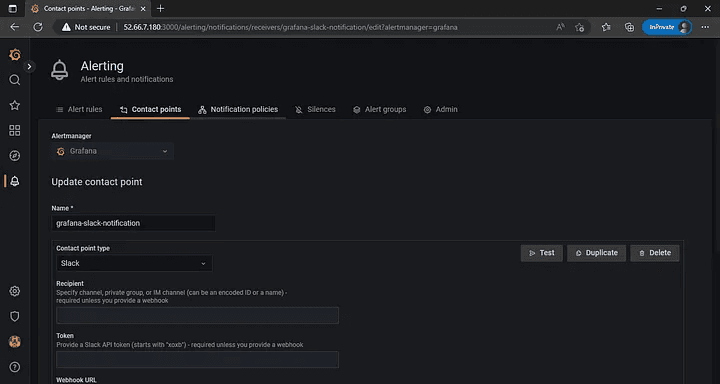
Step 2: Choose the new template by clicking on it. Fill in the Name field and paste the incoming webhook URL from Slack. You may also fill in the other optional information.
Step 3: After that, click the Test button to see if your webhook is functioning properly.
In my case, I got the below message on slack.
Now, let’s create an alert rule.
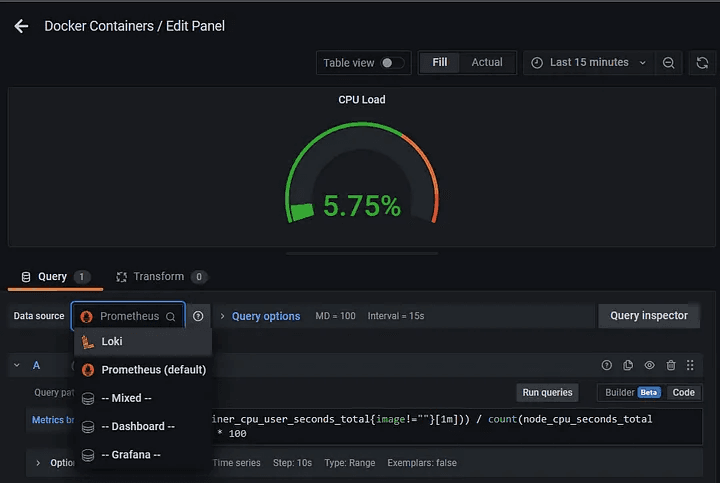
Step 4: Navigate to the Grafana dashboard and select the graph you wish to monitor.
In this situation, let us consider CPU.
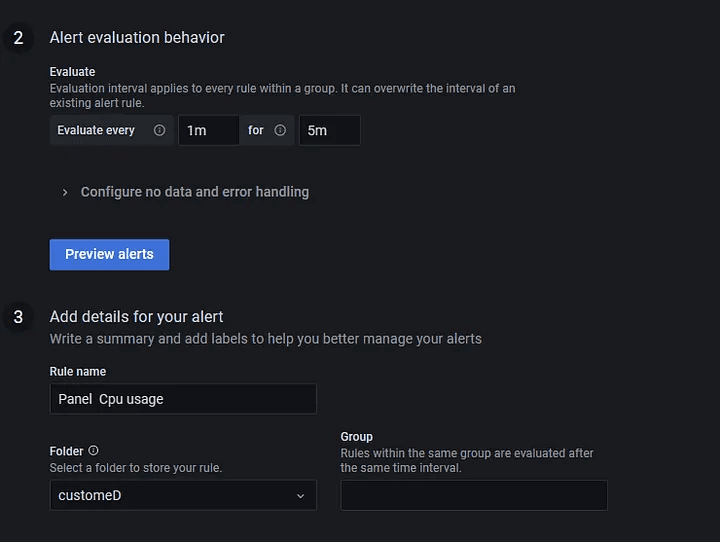
Step 5: We must create a new dashboard because we cannot create alerts in the default one. Copy the query and paste it into the new dashboard for the same result.

Step 6: To create an alert, navigate to alert on the new dashboard and select create an alert rule from the pane.
Configure according to requirements.Set alert behavior and alert details. Then click on save.
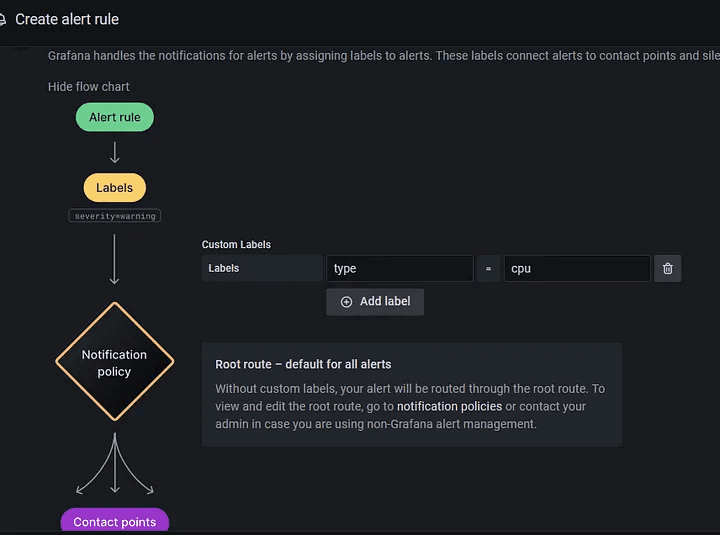
To map with contact points, you need to provide custom labels.
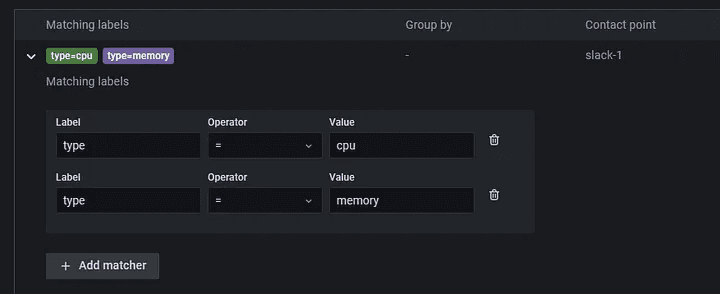
Step 7: Now, go to notification policy and add the labels you’ve added in the previous steps:
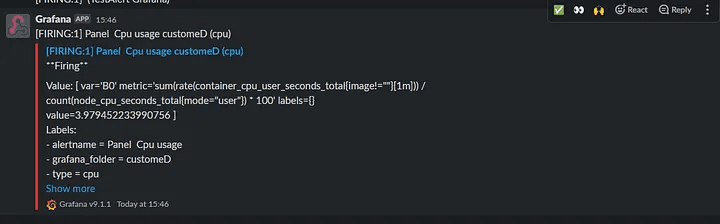
When the condition meets, you’ll get a notification on slack like this
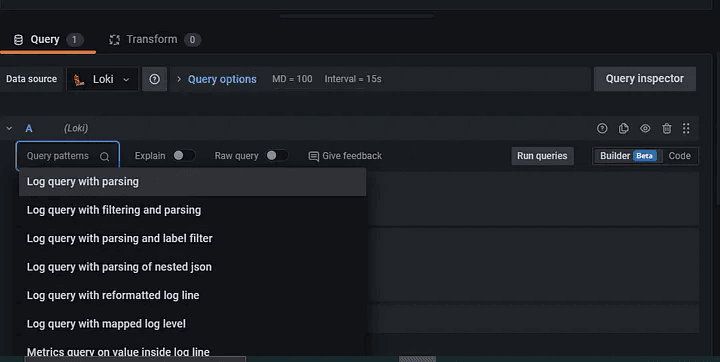
Now, let’s fetch log data for a specific container using Loki:
Step 1: Select Loki as a Data source.
Step 2: Select the first option in query patterns and click on Builder located on the right side.
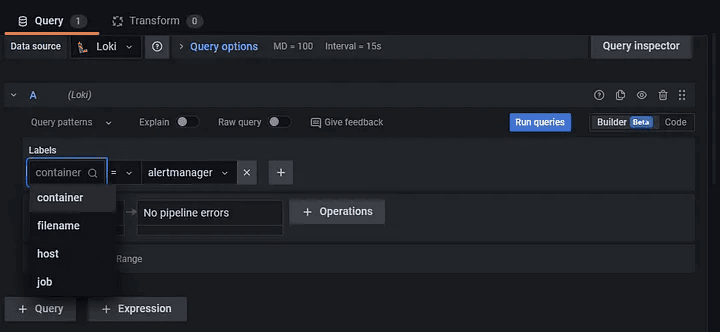
Step 3: Select the container as a label and select the container of which, you want longs.
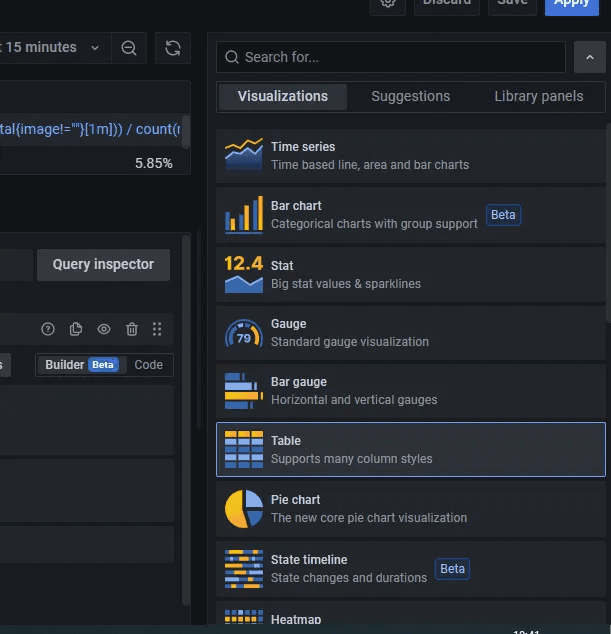
Select Table as the visualization option.
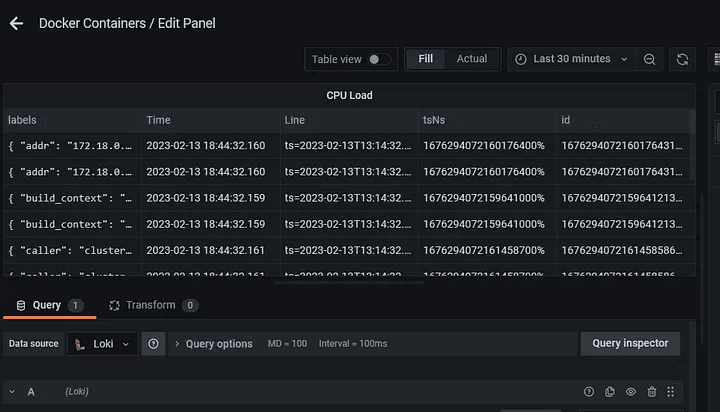
Now, you’ll able to get log data.
I hope this article was informative and provided you with the details you required. If you have any questions related while reading the blog, message me on Instagram or LinkedIn.For any kind of work related to DevOps, Site Reliability you can contact me at helpmeanubhav@gmail.comSpecial credits to my team members: Gaurav Kachariya and Krisha Amlani.Thank You…
A monitoring and logging solution for Docker hosts and containers with Prometheus, Grafana, Loki, cAdvisor, NodeExporter, and alerting with AlertManager.
Prometheus :
Prometheus is a toolbox for monitoring and alerting. Prometheus is an excellent tool for recording solely numerical time series. It is appropriate for both machine-centric monitoring and monitoring of highly dynamic service-oriented architectures. Its support for multi-dimensional data collecting and querying is a particular asset in a world of microservices.
Grafana :
It is a data-visualization platform that allows users to see their data via charts and graphs that are unified into one dashboard for easier interpretation and understanding. Grafana is commonly used to monitor the performance of applications, networks, and infrastructure. It has the ability to integrate with a wide range of data sources.
Another key feature of Grafana is its ability to create alerts based on the data displayed in the dashboards. Users can define conditions that trigger an alert, such as a threshold being exceeded, and configure the alert to be sent via email, Slack, or other notification channels.
Loki :
Loki is a horizontally scalable, highly available, multi-tenant log aggregation system inspired by Prometheus. It does not index the contents of the logs, but rather a set of labels for each log stream. Loki takes a unique approach by only indexing the metadata rather than the full text of the log lines.
Promtail :
Promtail is an agent which ships the contents of local logs to a private Grafana Loki instance or Grafana Cloud. It is usually deployed to every machine that has applications needed to be monitored.
cAdvisor :
cAdvisor (Container Advisor) provides container users with an understanding of the resource usage and performance characteristics of their running containers. It is a running daemon that collects, aggregates, processes, and exports information about running containers. Specifically, for each container, it keeps resource isolation parameters, historical resource usage, histograms of complete historical resource usage, and network statistics. This data is exported by container and machine-wide. cAdvisor has native support for Docker containers.
NodeExporter :
Node Exporter is a Prometheus exporter for server-level and OS-level metrics with configurable metric collectors. It helps us in measuring various server resources such as RAM, disk space, and CPU utilization. Node exporter is a good solution to collect all the Linux server-related metrics and statistics for monitoring.
Alert Manager :
The Alertmanager handles alerts sent by client applications such as the Prometheus server. It takes care of deduplicating, grouping, and routing them to the correct receiver integration such as email, PagerDuty, or OpsGenie. It also takes care of silencing and inhibition of alerts.
The following docker. compose.yaml file will create the monitoring for the docker container using all the elements mentioned below.
version: "3"
networks:
monitor-net:
driver: bridge
volumes:
prometheus_data: {}
grafana_data: {}
services:
prometheus:
image: prom/prometheus:v2.38.0
container_name: prometheus
volumes:
- ./prometheus:/etc/prometheus
- prometheus_data:/prometheus
command:
- '--config.file=/etc/prometheus/prometheus.yml'
- '--storage.tsdb.path=/prometheus'
- '--web.console.libraries=/etc/prometheus/console_libraries'
- '--web.console.templates=/etc/prometheus/consoles'
- '--storage.tsdb.retention.time=200h'
- '--web.enable-lifecycle'
restart: always
expose:
- 9090
networks:
- monitor-net
labels:
org.label-schema.group: "monitoring"
alertmanager:
image: prom/alertmanager:v0.24.0
container_name: alertmanager
volumes:
- ./alertmanager:/etc/alertmanager
command:
- '--config.file=/etc/alertmanager/config.yml'
- '--storage.path=/alertmanager'
restart: always
expose:
- 9093
networks:
- monitor-net
labels:
org.label-schema.group: "monitoring"
nodeexporter:
image: prom/node-exporter:v1.3.1
container_name: nodeexporter
volumes:
- /proc:/host/proc:ro
- /sys:/host/sys:ro
- /:/rootfs:ro
command:
- '--path.procfs=/host/proc'
- '--path.rootfs=/rootfs'
- '--path.sysfs=/host/sys'
'--collector.filesystem.mount-points-
exclude=^/(sys|proc|dev|host|etc)($$|/)'
restart: always
expose:
- 9100
networks:
- monitor-net
labels:
org.label-schema.group: "monitoring"
loki:
image: grafana/loki:2.6.0
container_name: loki
volumes:
- ./loki/loki-config.yaml:/etc/loki/loki-config.yaml
command: -config.file=/etc/loki/loki-config.yaml
expose:
- 3100
restart: always
networks:
- monitor-net
promtail:
image: grafana/promtail:2.6.0
container_name: promtail
volumes:
- /var/run/docker.sock:/var/run/docker.sock
- /var/log:/var/log:ro
- ./loki/promtail-config.yaml:/etc/promtail/promtail-config.yaml
command: -config.file=/etc/promtail/promtail-config.yaml
restart: always
networks:
- monitor-net
cadvisor:
image: gcr.io/cadvisor/cadvisor:v0.45.0
container_name: cadvisor
privileged: true
devices:
- /dev/kmsg:/dev/kmsg
volumes:
- /:/rootfs:ro
- /var/run:/var/run:ro
- /sys:/sys:ro
- /var/lib/docker:/var/lib/docker:ro
#- /cgroup:/cgroup:ro #doesn't work on MacOS only for Linux
restart: always
expose:
- 8080
networks:
- monitor-net
labels:
org.label-schema.group: "monitoring"
grafana:
image: grafana/grafana:9.1.1
container_name: grafana
volumes:
- grafana_data:/var/lib/grafana
- ./grafana/provisioning/dashboards:/etc/grafana/provisioning/dashboards
- ./grafana/provisioning/datasources:/etc/grafana/provisioning/datasources
env_file:
- config
restart: always
expose:
- 3000
networks:
- monitor-net
labels:
org.label-schema.group: "monitoring"
pushgateway:
image: prom/pushgateway:v1.4.3
container_name: pushgateway
restart: always
expose:
- 9091
networks:
- monitor-net
labels:
org.label-schema.group: "monitoring"
caddy:
image: caddy:2.3.0
container_name: caddy
ports:
- "3000:3000"
- "9090:9090"
- "8080:8080"
- "9093:9093"
- "9091:9091"
- "3100:3100"
volumes:
- ./caddy:/etc/caddy
environment:
- ADMIN_USER=${ADMIN_USER:-admin}
- ADMIN_PASSWORD=${ADMIN_PASSWORD:-admin}
- ADMIN_PASSWORD_HASH=${ADMIN_PASSWORD_HASH:-
JDJhJDE0JE91S1FrN0Z0VEsyWmhrQVpON1VzdHVLSDkyWHdsN0xNbEZYdnNIZm1pb2d1blg4Y09mL0ZP}
restart: always
networks:
- monitor-net
labels:
org.label-schema.group: "monitoring"
Now, let’s discuss the content written in the above file.
Here, we are using a bridge named monitor-net. So, all components can talk to each other. We have defined two volumes named grafana_data and prometheus_data. For all components, we are using official docker images defined in services in the file.
For Prometheus, we are using prom/prometheus:v2.38.0 docker image. The container name will be Prometheus and it uses port number 9000. Volume prometheus_data will be mounted to /Prometheus in the container.
Same as all other components are configured and they have exposed different ports.
Now, run docker-compose up -d. it will create all containers and start them. As shown in the below images, go to a particular port for a specific service.
Prometheus: 9090
Grafana:3000
cAdvisor: 8080
Prometheus push gateway: 9091
Now, let’s use Grafana to send a notification to Slack. Bear in mind that creating notifications in Grafana requires administrative privileges.
Step 1: To create the alert, we must first configure the contact points in Grafana. Go to the alerting section and select contact points. In our situation, we will configure Slack.
Step 2: Choose the new template by clicking on it. Fill in the Name field and paste the incoming webhook URL from Slack. You may also fill in the other optional information.
Step 3: After that, click the Test button to see if your webhook is functioning properly.
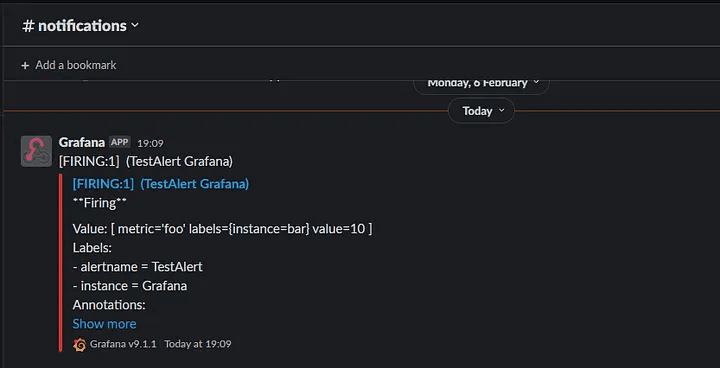
In my case, I got the below message on slack.
Now, let’s create an alert rule.
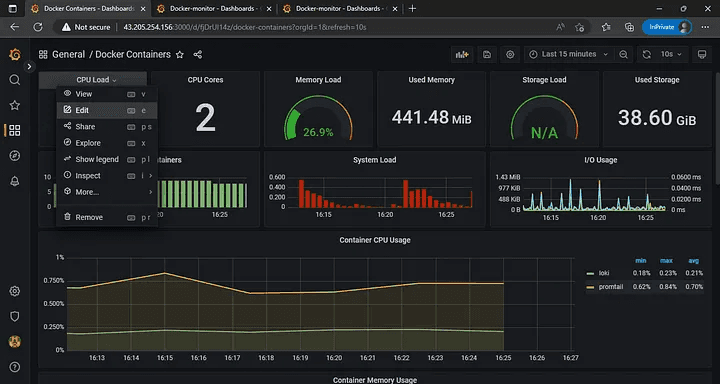
Step 4: Navigate to the Grafana dashboard and select the graph you wish to monitor.
In this situation, let us consider CPU.
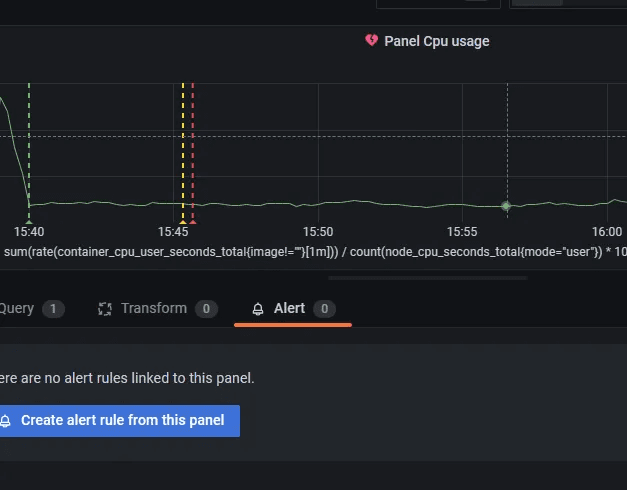
Step 5: We must create a new dashboard because we cannot create alerts in the default one. Copy the query and paste it into the new dashboard for the same result.
Step 6: To create an alert, navigate to alert on the new dashboard and select create an alert rule from the pane.
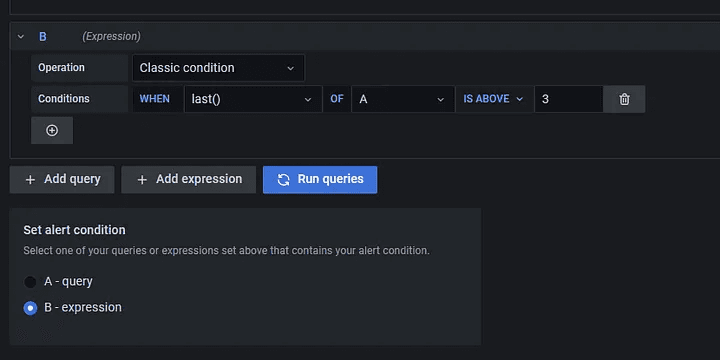
Configure according to requirements.Set alert behavior and alert details. Then click on save.
To map with contact points, you need to provide custom labels.
Step 7: Now, go to notification policy and add the labels you’ve added in the previous steps:
When the condition meets, you’ll get a notification on slack like this
Now, let’s fetch log data for a specific container using Loki:
Step 1: Select Loki as a Data source.
Step 2: Select the first option in query patterns and click on Builder located on the right side.
Step 3: Select the container as a label and select the container of which, you want longs.
Select Table as the visualization option.
Now, you’ll able to get log data.
I hope this article was informative and provided you with the details you required. If you have any questions related while reading the blog, message me on Instagram or LinkedIn.For any kind of work related to DevOps, Site Reliability you can contact me at helpmeanubhav@gmail.comSpecial credits to my team members: Gaurav Kachariya and Krisha Amlani.Thank You…
A monitoring and logging solution for Docker hosts and containers with Prometheus, Grafana, Loki, cAdvisor, NodeExporter, and alerting with AlertManager.
Prometheus :
Prometheus is a toolbox for monitoring and alerting. Prometheus is an excellent tool for recording solely numerical time series. It is appropriate for both machine-centric monitoring and monitoring of highly dynamic service-oriented architectures. Its support for multi-dimensional data collecting and querying is a particular asset in a world of microservices.
Grafana :
It is a data-visualization platform that allows users to see their data via charts and graphs that are unified into one dashboard for easier interpretation and understanding. Grafana is commonly used to monitor the performance of applications, networks, and infrastructure. It has the ability to integrate with a wide range of data sources.
Another key feature of Grafana is its ability to create alerts based on the data displayed in the dashboards. Users can define conditions that trigger an alert, such as a threshold being exceeded, and configure the alert to be sent via email, Slack, or other notification channels.
Loki :
Loki is a horizontally scalable, highly available, multi-tenant log aggregation system inspired by Prometheus. It does not index the contents of the logs, but rather a set of labels for each log stream. Loki takes a unique approach by only indexing the metadata rather than the full text of the log lines.
Promtail :
Promtail is an agent which ships the contents of local logs to a private Grafana Loki instance or Grafana Cloud. It is usually deployed to every machine that has applications needed to be monitored.
cAdvisor :
cAdvisor (Container Advisor) provides container users with an understanding of the resource usage and performance characteristics of their running containers. It is a running daemon that collects, aggregates, processes, and exports information about running containers. Specifically, for each container, it keeps resource isolation parameters, historical resource usage, histograms of complete historical resource usage, and network statistics. This data is exported by container and machine-wide. cAdvisor has native support for Docker containers.
NodeExporter :
Node Exporter is a Prometheus exporter for server-level and OS-level metrics with configurable metric collectors. It helps us in measuring various server resources such as RAM, disk space, and CPU utilization. Node exporter is a good solution to collect all the Linux server-related metrics and statistics for monitoring.
Alert Manager :
The Alertmanager handles alerts sent by client applications such as the Prometheus server. It takes care of deduplicating, grouping, and routing them to the correct receiver integration such as email, PagerDuty, or OpsGenie. It also takes care of silencing and inhibition of alerts.
The following docker. compose.yaml file will create the monitoring for the docker container using all the elements mentioned below.
version: "3"
networks:
monitor-net:
driver: bridge
volumes:
prometheus_data: {}
grafana_data: {}
services:
prometheus:
image: prom/prometheus:v2.38.0
container_name: prometheus
volumes:
- ./prometheus:/etc/prometheus
- prometheus_data:/prometheus
command:
- '--config.file=/etc/prometheus/prometheus.yml'
- '--storage.tsdb.path=/prometheus'
- '--web.console.libraries=/etc/prometheus/console_libraries'
- '--web.console.templates=/etc/prometheus/consoles'
- '--storage.tsdb.retention.time=200h'
- '--web.enable-lifecycle'
restart: always
expose:
- 9090
networks:
- monitor-net
labels:
org.label-schema.group: "monitoring"
alertmanager:
image: prom/alertmanager:v0.24.0
container_name: alertmanager
volumes:
- ./alertmanager:/etc/alertmanager
command:
- '--config.file=/etc/alertmanager/config.yml'
- '--storage.path=/alertmanager'
restart: always
expose:
- 9093
networks:
- monitor-net
labels:
org.label-schema.group: "monitoring"
nodeexporter:
image: prom/node-exporter:v1.3.1
container_name: nodeexporter
volumes:
- /proc:/host/proc:ro
- /sys:/host/sys:ro
- /:/rootfs:ro
command:
- '--path.procfs=/host/proc'
- '--path.rootfs=/rootfs'
- '--path.sysfs=/host/sys'
'--collector.filesystem.mount-points-
exclude=^/(sys|proc|dev|host|etc)($$|/)'
restart: always
expose:
- 9100
networks:
- monitor-net
labels:
org.label-schema.group: "monitoring"
loki:
image: grafana/loki:2.6.0
container_name: loki
volumes:
- ./loki/loki-config.yaml:/etc/loki/loki-config.yaml
command: -config.file=/etc/loki/loki-config.yaml
expose:
- 3100
restart: always
networks:
- monitor-net
promtail:
image: grafana/promtail:2.6.0
container_name: promtail
volumes:
- /var/run/docker.sock:/var/run/docker.sock
- /var/log:/var/log:ro
- ./loki/promtail-config.yaml:/etc/promtail/promtail-config.yaml
command: -config.file=/etc/promtail/promtail-config.yaml
restart: always
networks:
- monitor-net
cadvisor:
image: gcr.io/cadvisor/cadvisor:v0.45.0
container_name: cadvisor
privileged: true
devices:
- /dev/kmsg:/dev/kmsg
volumes:
- /:/rootfs:ro
- /var/run:/var/run:ro
- /sys:/sys:ro
- /var/lib/docker:/var/lib/docker:ro
#- /cgroup:/cgroup:ro #doesn't work on MacOS only for Linux
restart: always
expose:
- 8080
networks:
- monitor-net
labels:
org.label-schema.group: "monitoring"
grafana:
image: grafana/grafana:9.1.1
container_name: grafana
volumes:
- grafana_data:/var/lib/grafana
- ./grafana/provisioning/dashboards:/etc/grafana/provisioning/dashboards
- ./grafana/provisioning/datasources:/etc/grafana/provisioning/datasources
env_file:
- config
restart: always
expose:
- 3000
networks:
- monitor-net
labels:
org.label-schema.group: "monitoring"
pushgateway:
image: prom/pushgateway:v1.4.3
container_name: pushgateway
restart: always
expose:
- 9091
networks:
- monitor-net
labels:
org.label-schema.group: "monitoring"
caddy:
image: caddy:2.3.0
container_name: caddy
ports:
- "3000:3000"
- "9090:9090"
- "8080:8080"
- "9093:9093"
- "9091:9091"
- "3100:3100"
volumes:
- ./caddy:/etc/caddy
environment:
- ADMIN_USER=${ADMIN_USER:-admin}
- ADMIN_PASSWORD=${ADMIN_PASSWORD:-admin}
- ADMIN_PASSWORD_HASH=${ADMIN_PASSWORD_HASH:-
JDJhJDE0JE91S1FrN0Z0VEsyWmhrQVpON1VzdHVLSDkyWHdsN0xNbEZYdnNIZm1pb2d1blg4Y09mL0ZP}
restart: always
networks:
- monitor-net
labels:
org.label-schema.group: "monitoring"
Now, let’s discuss the content written in the above file.
Here, we are using a bridge named monitor-net. So, all components can talk to each other. We have defined two volumes named grafana_data and prometheus_data. For all components, we are using official docker images defined in services in the file.
For Prometheus, we are using prom/prometheus:v2.38.0 docker image. The container name will be Prometheus and it uses port number 9000. Volume prometheus_data will be mounted to /Prometheus in the container.
Same as all other components are configured and they have exposed different ports.
Now, run docker-compose up -d. it will create all containers and start them. As shown in the below images, go to a particular port for a specific service.
Prometheus: 9090
Grafana:3000
cAdvisor: 8080
Prometheus push gateway: 9091
Now, let’s use Grafana to send a notification to Slack. Bear in mind that creating notifications in Grafana requires administrative privileges.
Step 1: To create the alert, we must first configure the contact points in Grafana. Go to the alerting section and select contact points. In our situation, we will configure Slack.
Step 2: Choose the new template by clicking on it. Fill in the Name field and paste the incoming webhook URL from Slack. You may also fill in the other optional information.
Step 3: After that, click the Test button to see if your webhook is functioning properly.
In my case, I got the below message on slack.
Now, let’s create an alert rule.
Step 4: Navigate to the Grafana dashboard and select the graph you wish to monitor.
In this situation, let us consider CPU.
Step 5: We must create a new dashboard because we cannot create alerts in the default one. Copy the query and paste it into the new dashboard for the same result.
Step 6: To create an alert, navigate to alert on the new dashboard and select create an alert rule from the pane.
Configure according to requirements.Set alert behavior and alert details. Then click on save.
To map with contact points, you need to provide custom labels.
Step 7: Now, go to notification policy and add the labels you’ve added in the previous steps:
When the condition meets, you’ll get a notification on slack like this
Now, let’s fetch log data for a specific container using Loki:
Step 1: Select Loki as a Data source.
Step 2: Select the first option in query patterns and click on Builder located on the right side.
Step 3: Select the container as a label and select the container of which, you want longs.
Select Table as the visualization option.
Now, you’ll able to get log data.
I hope this article was informative and provided you with the details you required. If you have any questions related while reading the blog, message me on Instagram or LinkedIn.For any kind of work related to DevOps, Site Reliability you can contact me at helpmeanubhav@gmail.comSpecial credits to my team members: Gaurav Kachariya and Krisha Amlani.Thank You…