Enable Alerts from AWS CloudWatch through Mail.
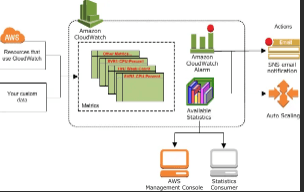
This blog will show you how to receive alerts from AWS CloudWatch for any AWS service, such as EC2, through email and receive notifications for the same service.
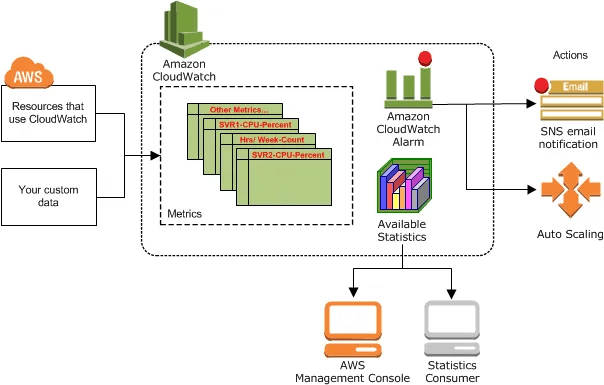
I want to use it to monitor the performance of my AWS EC2 machine. You must first find a way to keep track of your workload so that you can make adjustments in order to cut costs. If the CPU use of your EC2 instance exceeds the threshold, alert management will notify you that Your EC2 instance CPU utilization is beyond the threshold and needed some action to be performed.
So let’s start our journey,
Step 1: To begin, you must first have an AWS account. I’m assuming you have one already, if not make one. You should definitely build one using the https://aws.amazon.com/console/ link.
AWS Management Console
Everything you need to access and manage the AWS Cloud - in one web interface Get additional help with support plans…
aws.amazon.com
Step 2: After setting up an account, you will have access to the AWS dashboard, as seen in the screenshot below.
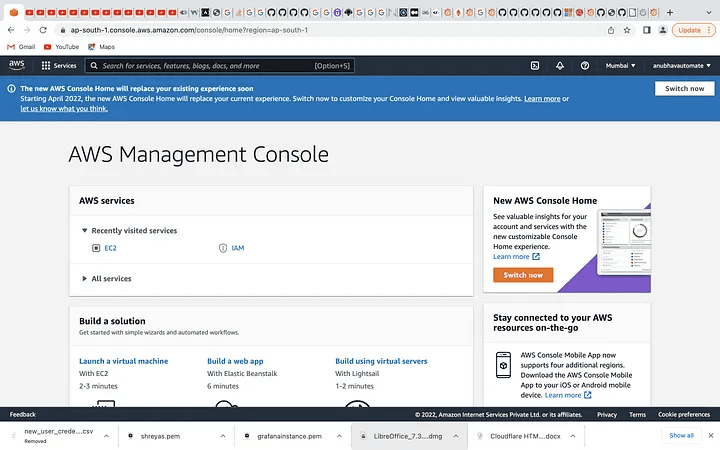
AWS dashboard
Step 3: Immediately after entering, look for the AWS EC2 service in the top search box. If you click on it, the EC2 Dashboard will appear.
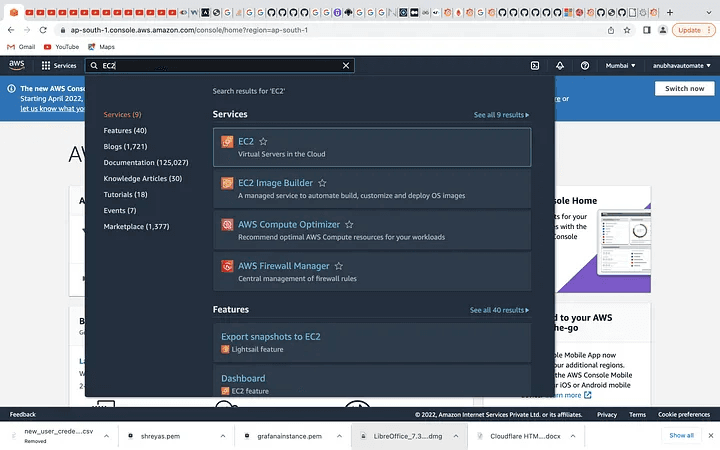
EC2 Dashboard
Step 4: In the EC2 dashboard, none of the instances are currently operating. I have multiple instances that I’ve generated on the Dashboard. The steps listed below must be followed in order to create an instance:
Step 1: Choose an Amazon Machine Image (AMI)
Step 2: Choose an Instance Type.
Step 3: Configure Instance Details.
Step 4: Add Storage. (30 GB)
Step 5: Add Tags. (optional)
Step 6: Configure Security Group.
Step 7: Review Instance Launch and Select Key Pair.
Launching the instance comes after saving the key pair file (pem file) in a secure location. Then, your freshly formed instance will appear on the EC2 dashboard. When it comes to the running state, our instance (Demo) is initially in the pending state. It’s accessible to you. The example photo is shown below.
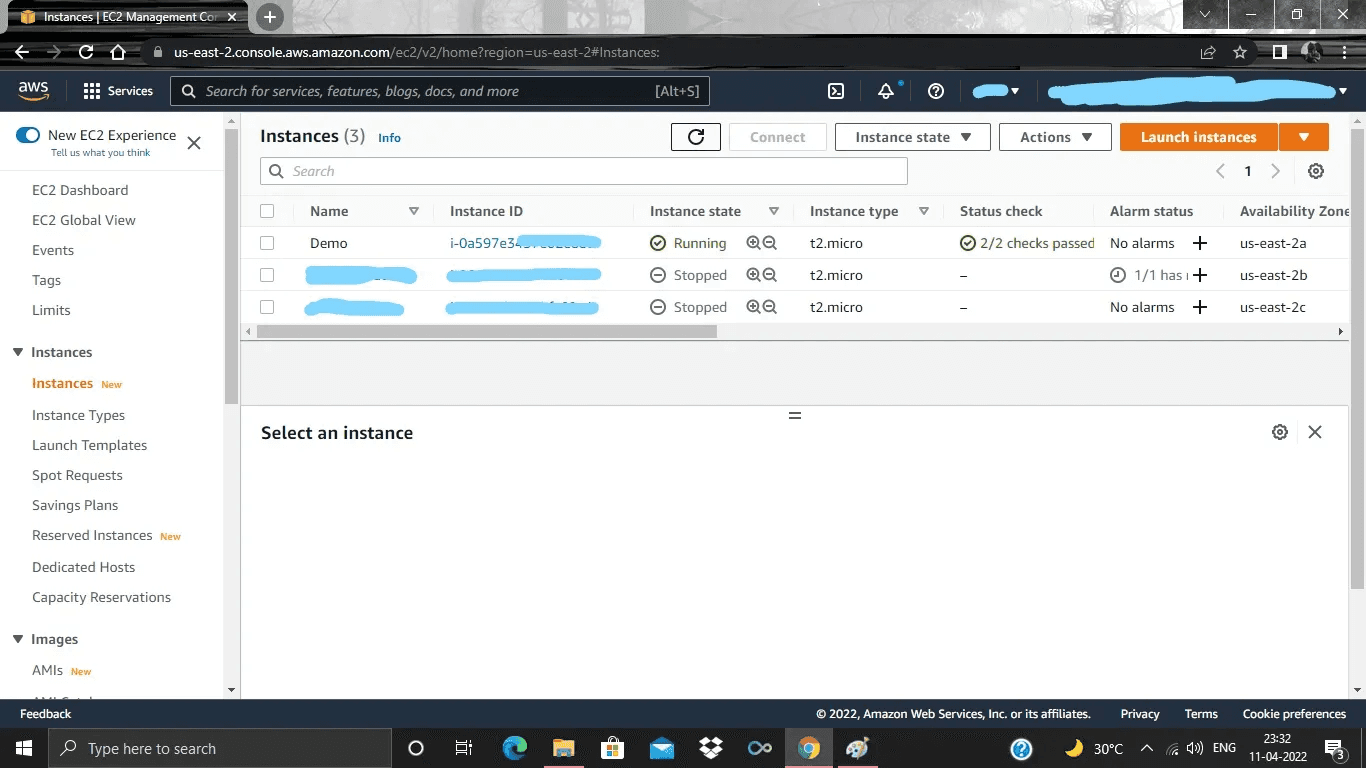
Instances
NOTE: Do not share the “Pem file” with anyone.
Step 5: You must now SSH into the most recent instance (Demo) you built. Run the following command in your terminal from the place where you have stored your pem file to do this.
ssh -i "Your pem key" ubuntu@your_pubilcIPV4address
Step 6: You need to have something within your instance to check the CPU utilization, but don’t worry, we have another blog with Grafana installed, and we keep an eye on that EC2 instance; if the CPU utilization goes beyond the given threshold, you will receive an email message.
Step 7: Go to your instance’s monitoring as soon as you have the Grafana installed, and then choose View in metric next to CPU utilization.
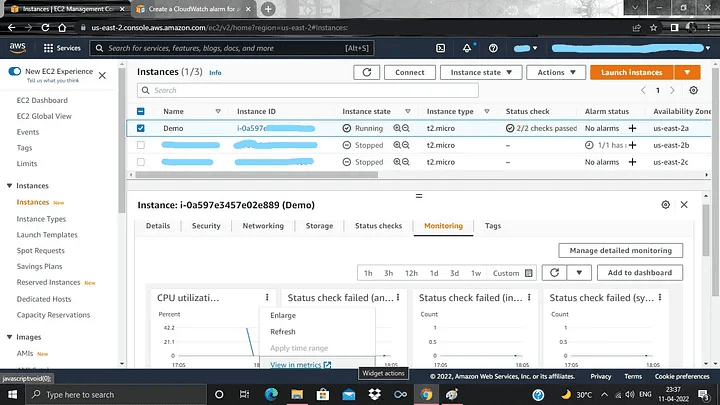
Metrics
Step 8: From there, you’ll be sent to the CloudWatch metrics page. To establish an alarm or alert on the chosen EC2 instance, click the “bell” icon here. The example photo is shown below.
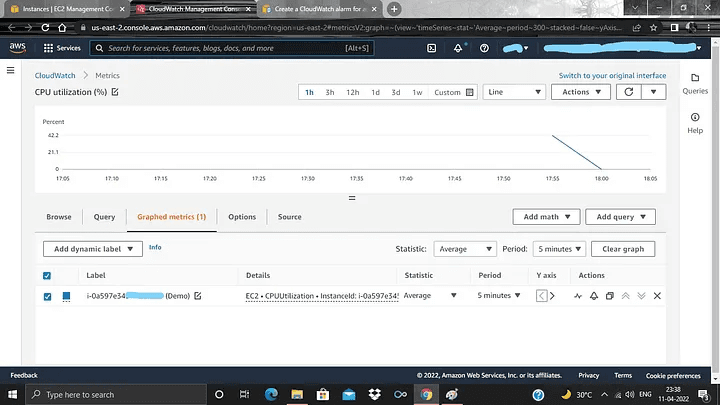
CloudWatch Metrics Pages
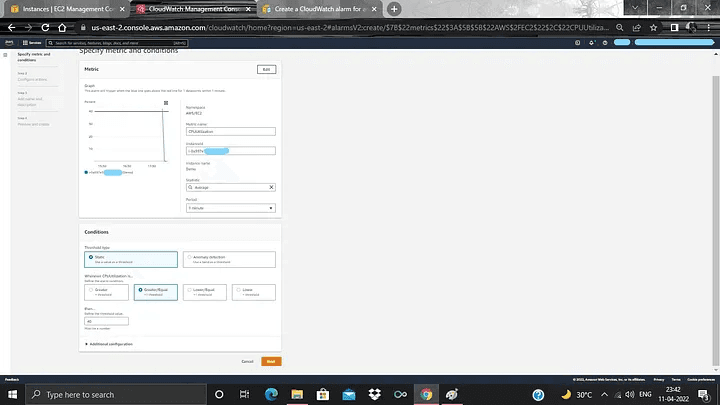
Step 9: The CloudWatch Alert section will then appear, where you must create an alarm. The example photo is shown below.
CloudWatch Alert Section
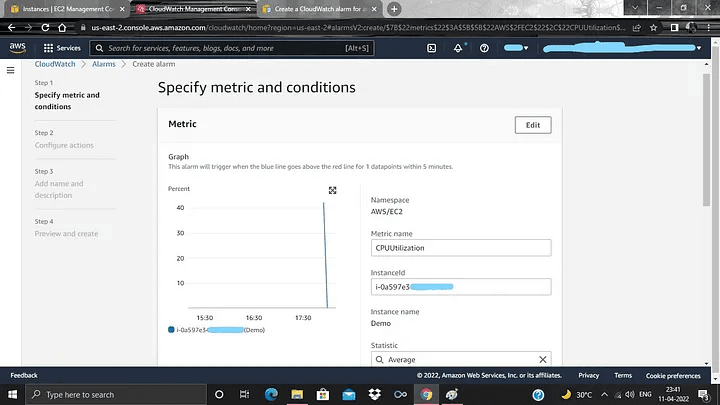
Step 10: At this point, you must specify the threshold you desire for your instance. Once again, this will depend on the contents of your instance. It indicates 40% in my situation. I continue to use 40 as my “more and equal” threshold. So, if the CPU utilization of the instance again exceeds 40% and remains there for one minute, something is wrong. I’ll get a notifying me via mail. Here is an example of a snapshot.
Step 11: Next, you must select “Next” to set up the SNS topic (Simple Notification Service), in which you must give the email address to which you wish to receive notifications. After providing the information, click “Next.” You will then receive a membership activation email, and you must click the “confirm Subscription” link there, as seen in the screenshot below.
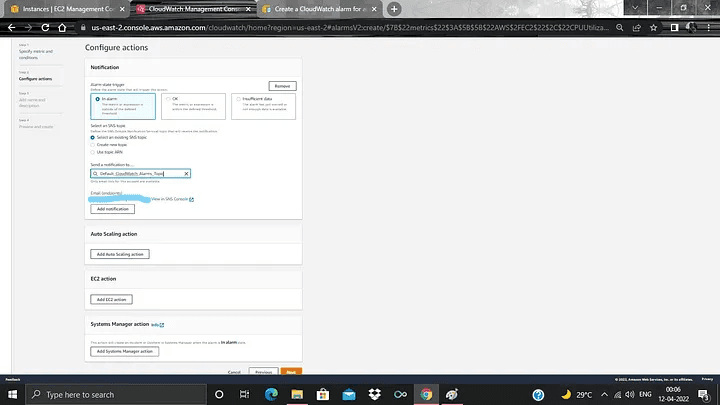
Need to confirm the subscription
Step 12: At this point, you must name the alarm and click “Next,” as seen in the sample below.
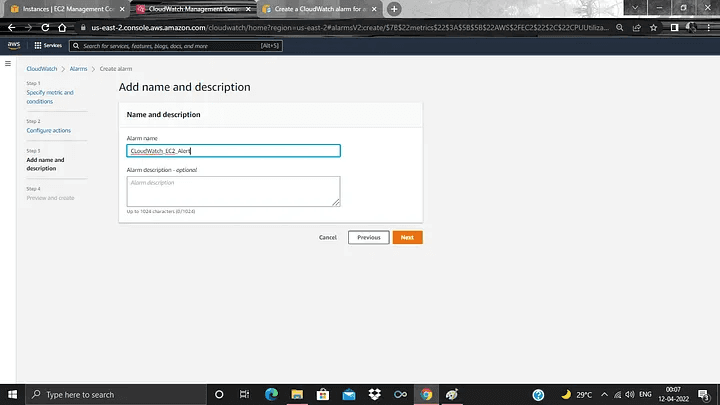
Enter your details
Step 13: Review your alarm configuration here, then select “make alarm” as the one below.
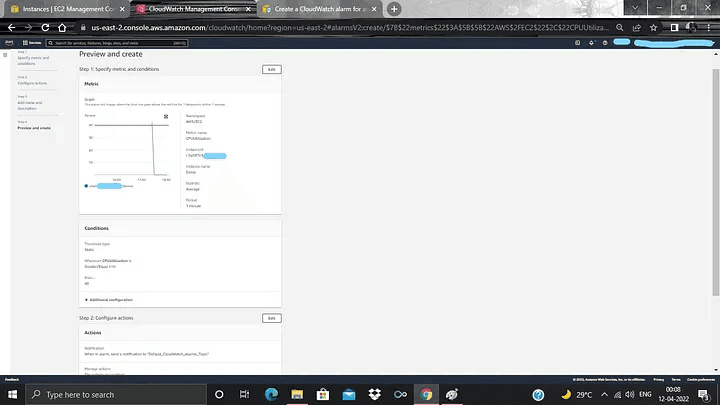
Alarm Config
Step 14: Thereafter, you will be getting your alarm on the CloudWatch dashboard. Below is the sample snapshot.
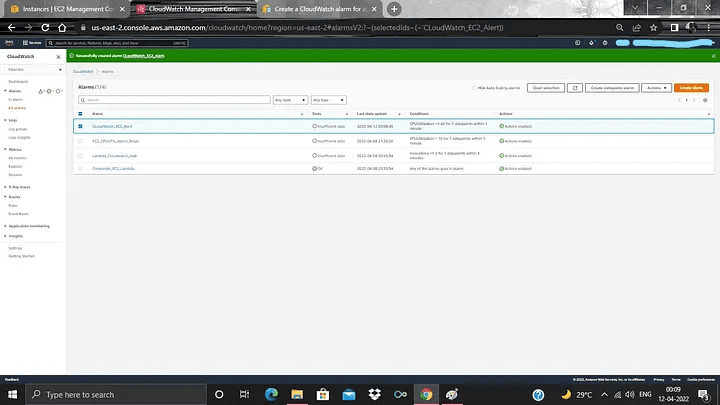
CloudWatch Dashboard
Step 15: Now, if your instance’s CPU Utilization gets above or equal to 40%, you will get a notification via mail. Like below sample snapshot.
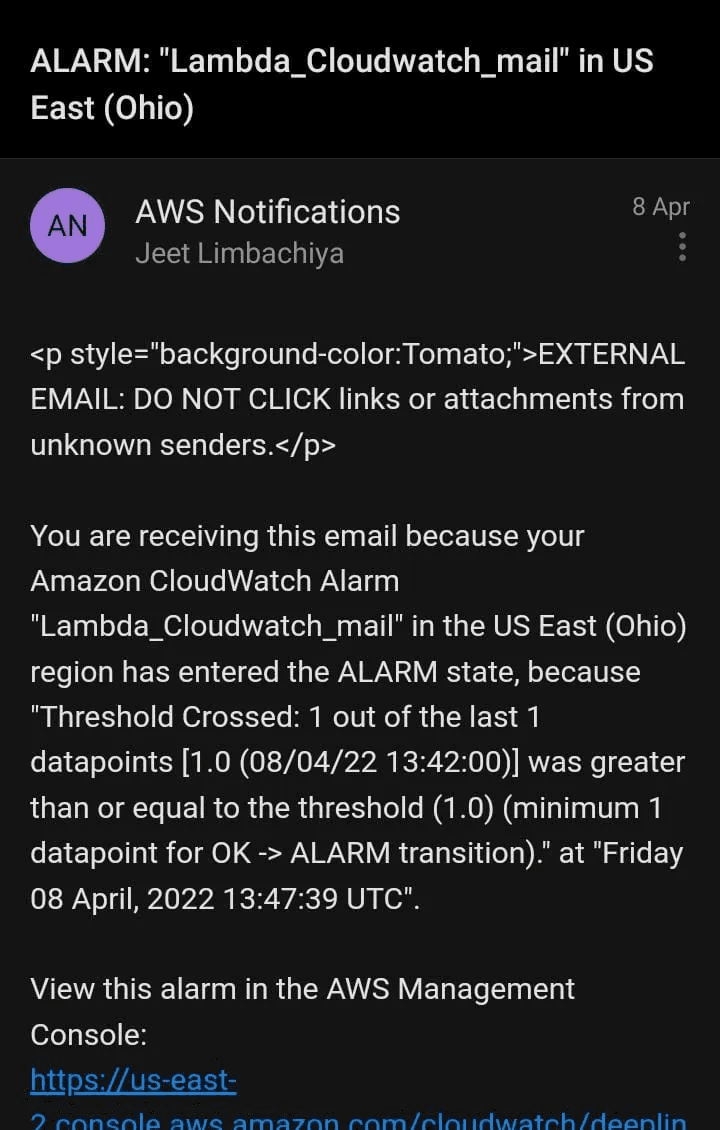
Mail Notification
I hope this article was informative and provided you with the details you required. If you have any questions while reading the blog, message me on Instagram or LinkedIn. Special credits to my team member: Krisha Amlani.
Thank You…
This blog will show you how to receive alerts from AWS CloudWatch for any AWS service, such as EC2, through email and receive notifications for the same service.
I want to use it to monitor the performance of my AWS EC2 machine. You must first find a way to keep track of your workload so that you can make adjustments in order to cut costs. If the CPU use of your EC2 instance exceeds the threshold, alert management will notify you that Your EC2 instance CPU utilization is beyond the threshold and needed some action to be performed.
So let’s start our journey,
Step 1: To begin, you must first have an AWS account. I’m assuming you have one already, if not make one. You should definitely build one using the https://aws.amazon.com/console/ link.
AWS Management Console
Everything you need to access and manage the AWS Cloud - in one web interface Get additional help with support plans…
aws.amazon.com
Step 2: After setting up an account, you will have access to the AWS dashboard, as seen in the screenshot below.
AWS dashboard
Step 3: Immediately after entering, look for the AWS EC2 service in the top search box. If you click on it, the EC2 Dashboard will appear.
EC2 Dashboard
Step 4: In the EC2 dashboard, none of the instances are currently operating. I have multiple instances that I’ve generated on the Dashboard. The steps listed below must be followed in order to create an instance:
Step 1: Choose an Amazon Machine Image (AMI)
Step 2: Choose an Instance Type.
Step 3: Configure Instance Details.
Step 4: Add Storage. (30 GB)
Step 5: Add Tags. (optional)
Step 6: Configure Security Group.
Step 7: Review Instance Launch and Select Key Pair.
Launching the instance comes after saving the key pair file (pem file) in a secure location. Then, your freshly formed instance will appear on the EC2 dashboard. When it comes to the running state, our instance (Demo) is initially in the pending state. It’s accessible to you. The example photo is shown below.
Instances
NOTE: Do not share the “Pem file” with anyone.
Step 5: You must now SSH into the most recent instance (Demo) you built. Run the following command in your terminal from the place where you have stored your pem file to do this.
ssh -i "Your pem key" ubuntu@your_pubilcIPV4address
Step 6: You need to have something within your instance to check the CPU utilization, but don’t worry, we have another blog with Grafana installed, and we keep an eye on that EC2 instance; if the CPU utilization goes beyond the given threshold, you will receive an email message.
Step 7: Go to your instance’s monitoring as soon as you have the Grafana installed, and then choose View in metric next to CPU utilization.
Metrics
Step 8: From there, you’ll be sent to the CloudWatch metrics page. To establish an alarm or alert on the chosen EC2 instance, click the “bell” icon here. The example photo is shown below.
CloudWatch Metrics Pages
Step 9: The CloudWatch Alert section will then appear, where you must create an alarm. The example photo is shown below.
CloudWatch Alert Section
Step 10: At this point, you must specify the threshold you desire for your instance. Once again, this will depend on the contents of your instance. It indicates 40% in my situation. I continue to use 40 as my “more and equal” threshold. So, if the CPU utilization of the instance again exceeds 40% and remains there for one minute, something is wrong. I’ll get a notifying me via mail. Here is an example of a snapshot.
Step 11: Next, you must select “Next” to set up the SNS topic (Simple Notification Service), in which you must give the email address to which you wish to receive notifications. After providing the information, click “Next.” You will then receive a membership activation email, and you must click the “confirm Subscription” link there, as seen in the screenshot below.
Need to confirm the subscription
Step 12: At this point, you must name the alarm and click “Next,” as seen in the sample below.
Enter your details
Step 13: Review your alarm configuration here, then select “make alarm” as the one below.
Alarm Config
Step 14: Thereafter, you will be getting your alarm on the CloudWatch dashboard. Below is the sample snapshot.
CloudWatch Dashboard
Step 15: Now, if your instance’s CPU Utilization gets above or equal to 40%, you will get a notification via mail. Like below sample snapshot.
Mail Notification
I hope this article was informative and provided you with the details you required. If you have any questions while reading the blog, message me on Instagram or LinkedIn. Special credits to my team member: Krisha Amlani.
Thank You…